Skip to main content
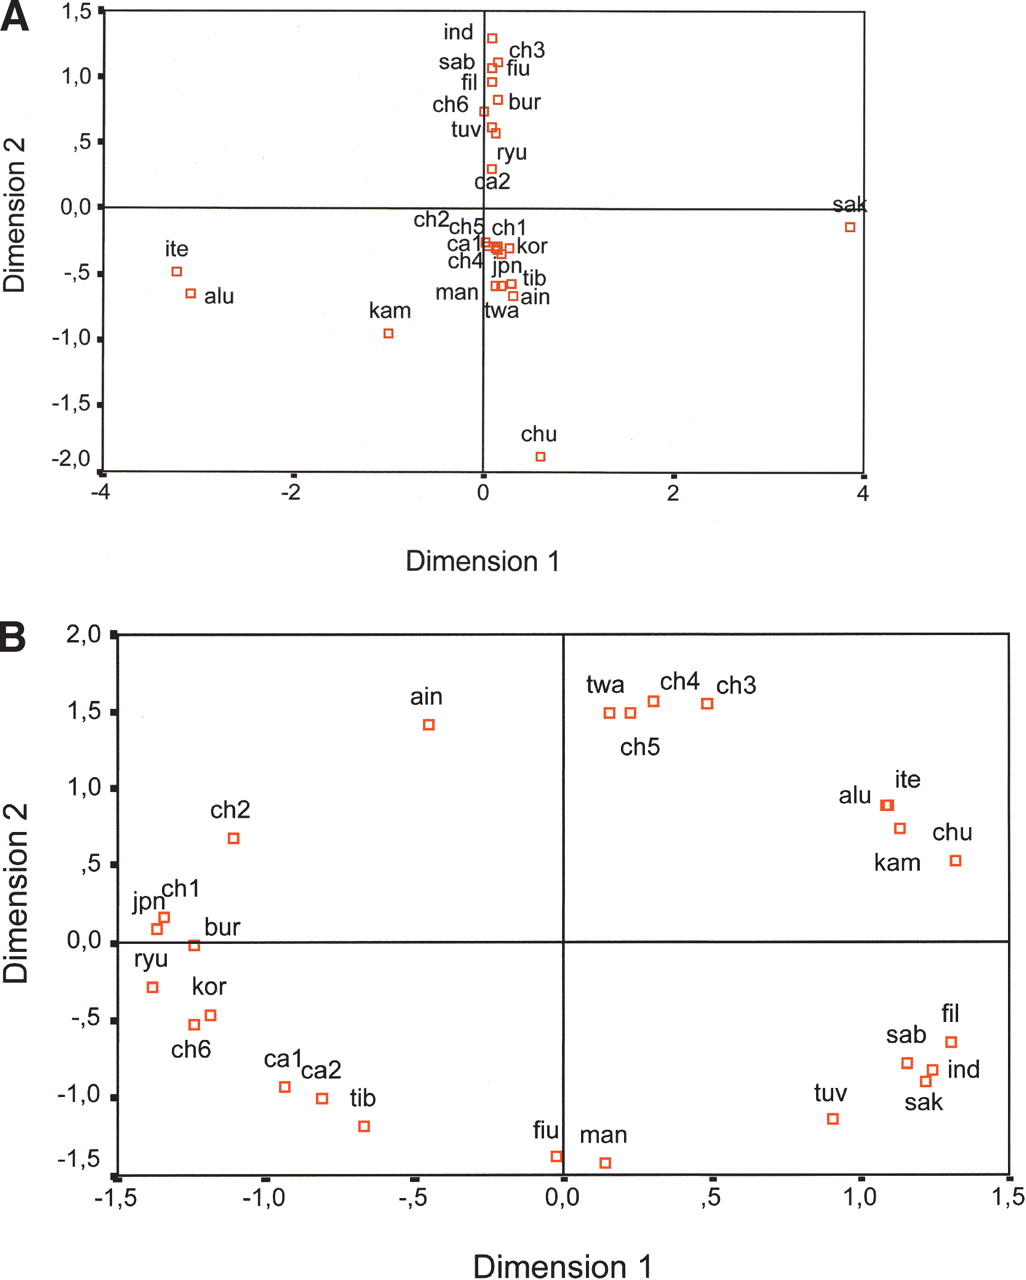
Figure 3
MDS plots based on (
A
) F
ST
and (
B
) D match distances. Population groups are as detailed in
Table 3
.