Figure 4
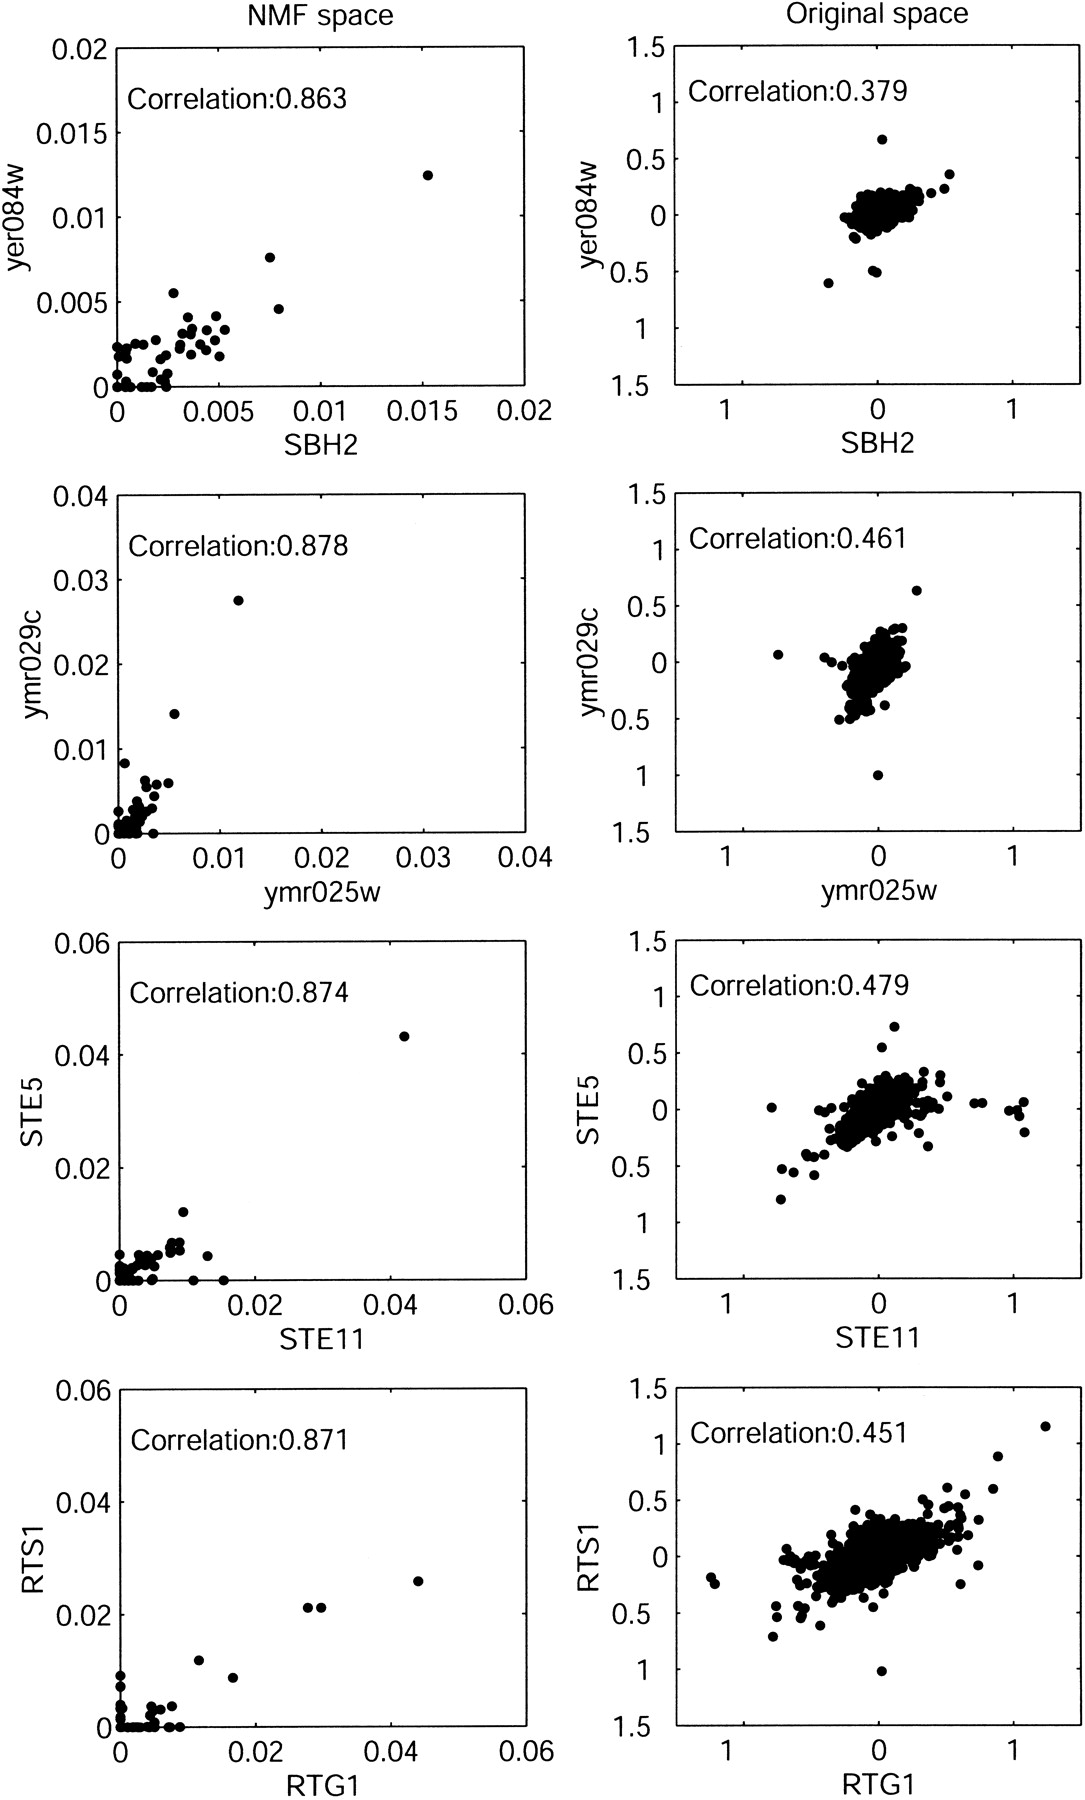
Correlation for four illustrative pairwise functional genetic relationships. For comparison, the correlation plot of the pair of experiments in NMF space is shown at left, and in the original gene space at right.
Correlation for four illustrative pairwise functional genetic relationships. For comparison, the correlation plot of the pair of experiments in NMF space is shown at left, and in the original gene space at right.