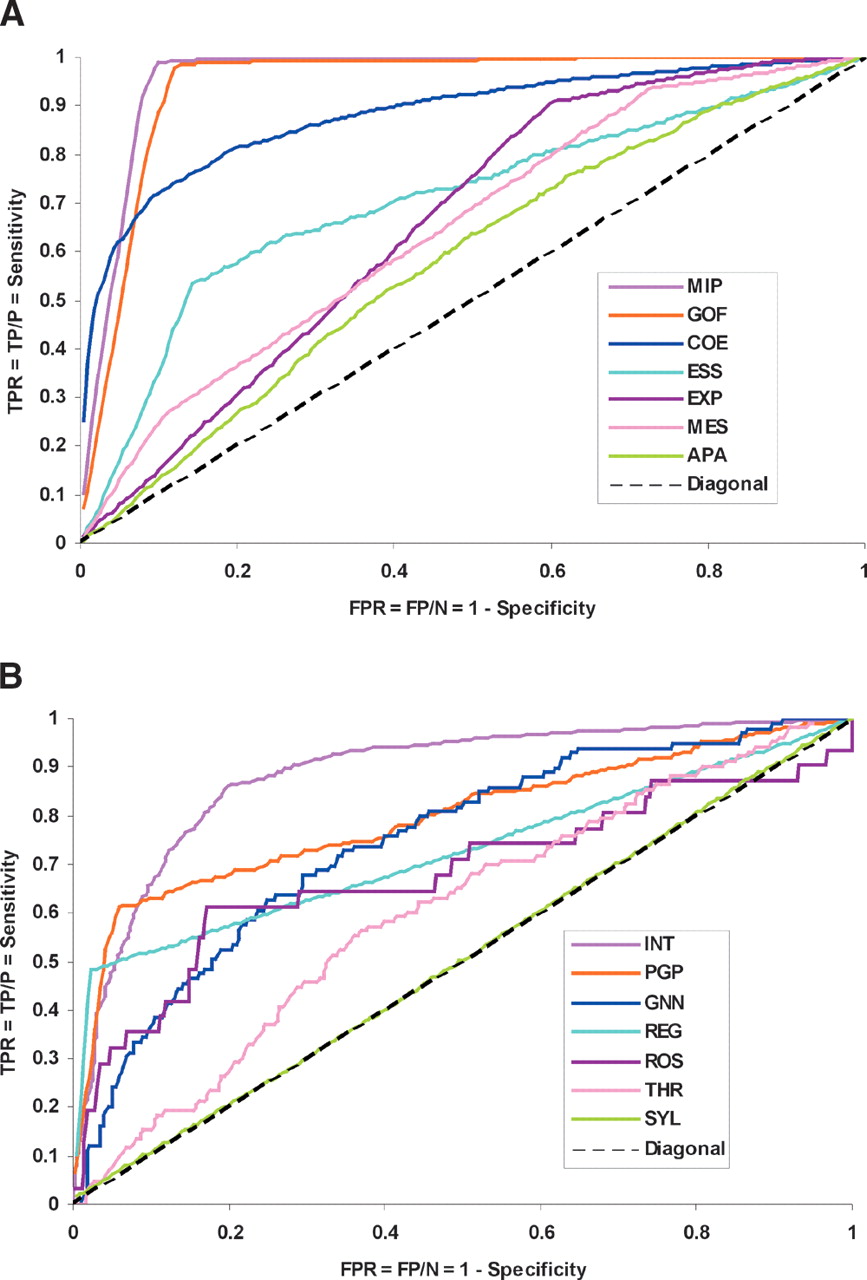
Figure 3.
Predictive power of individual features illustrated by ROC curves. We plot ROC curves for individual features in two panels; the seven most populous features in A, and the remaining nine features in B. The acronyms signify the following: (TPR) True positive rate; (FPR) false positive rate; (TP) true positives; (FP) false positives; (P) total number of positives; (N) total number of negatives (see Methods).