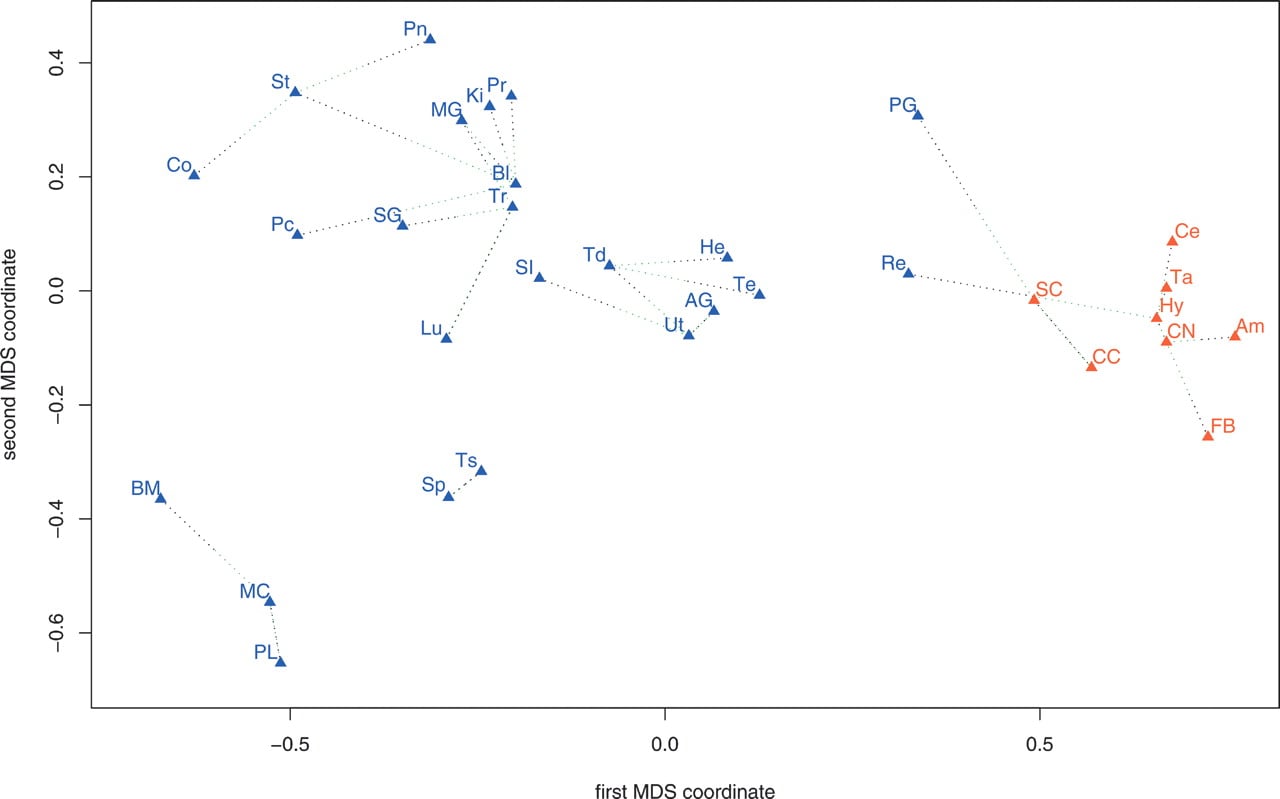
Multidimensional separation plot of the distance between gene expression patterns in the 32 tissues. The values of the pairwise correlations between expression vectors, r, were calculated from the natural logarithms of the expression values, and the distance measure d = (1 - r) was used as input for the MDS routine in the multivariate analysis package of R. The CNS tissues are red. Tissues are (AG) adrenal gland; (Bl) bladder; (BM) bone marrow; (Am) amygdala; (CN) caudate nucleus; (Ce) cerebellum; (CC) corpus callosum; (FB) fetal brain; (Hy) hypothalamus; (Ta) thalamus; (He) heart; (Ki) kidney; (Lu) lung; (MG) mammary gland; (Pn) pancreas; (PG) pituitary gland; (Pc) placenta; (Pr) prostate; (Re) retina; (SG) salivary gland; (SI) small intestine; (SC) spinal cord; (Sp) spleen; (St) stomach; (Te) testis; (Ts) thymus; (Td) thyroid; (Tr) trachea; (Ut) uterus; (Co) colon; (MC) monocytes; (PL) peripheral blood lymphocytes.