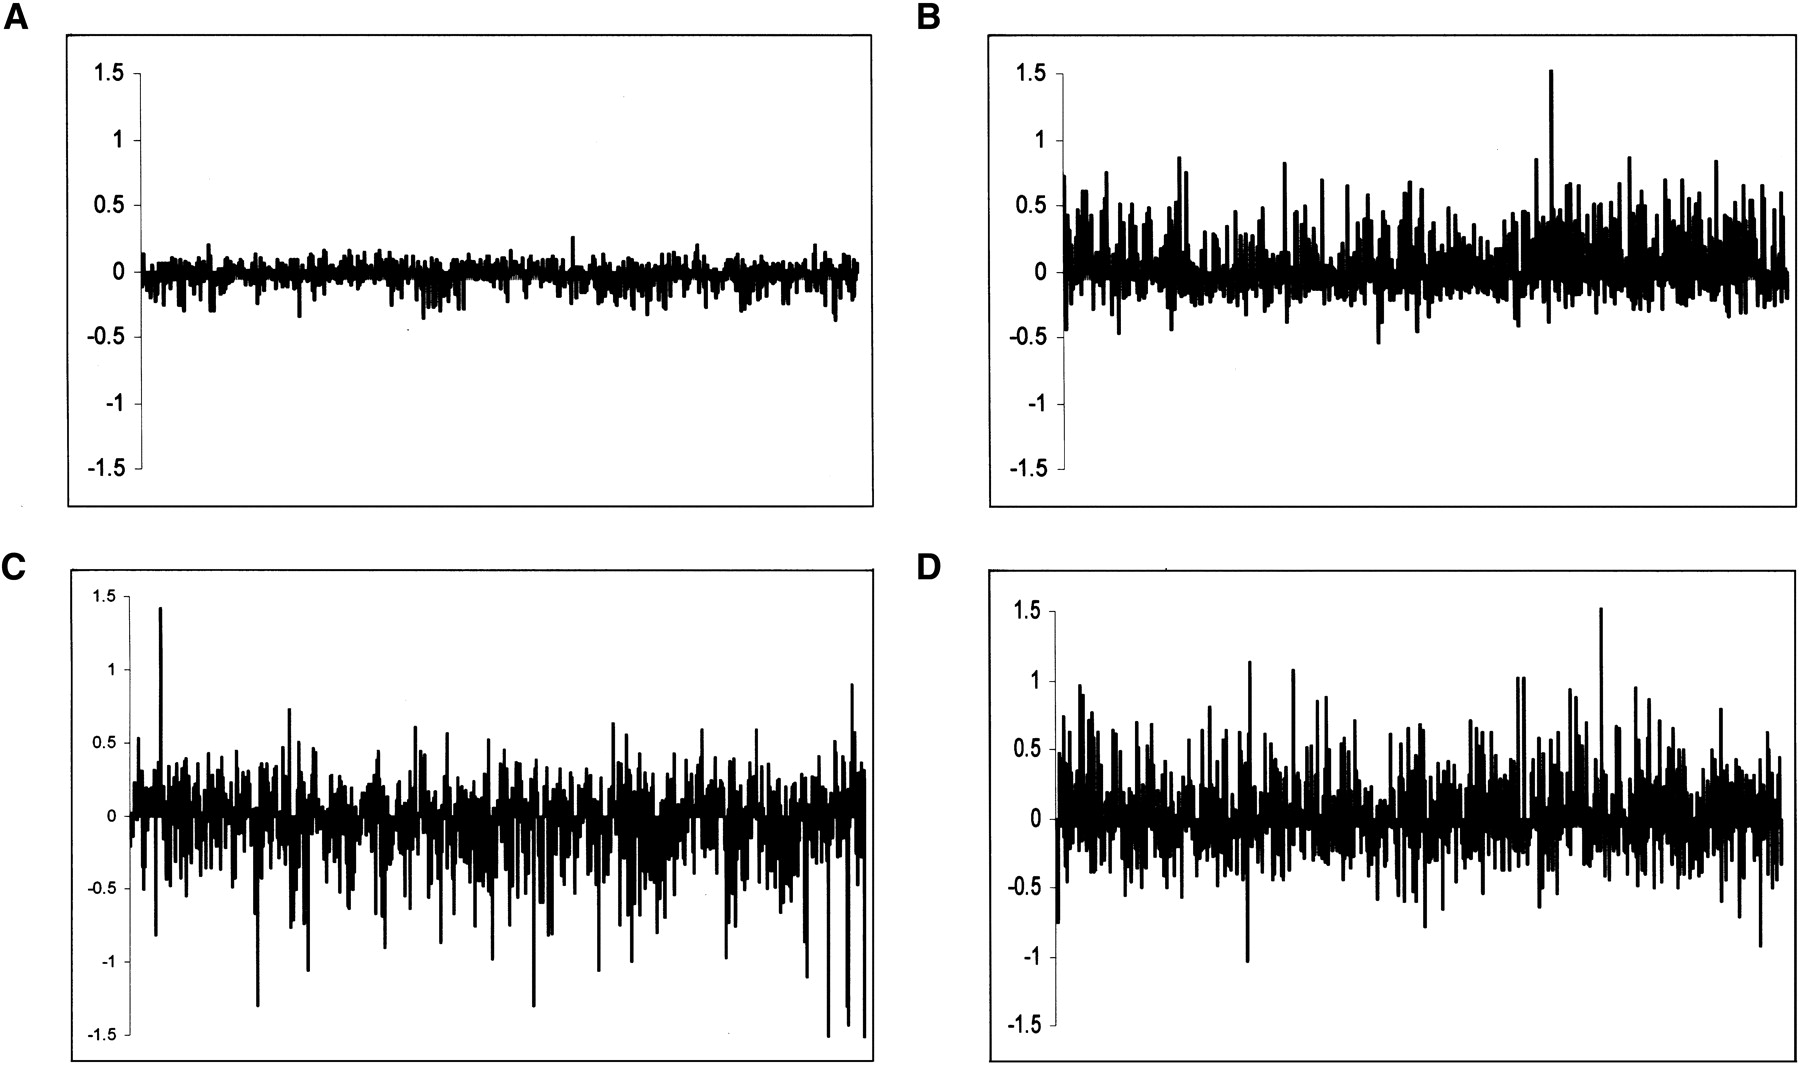
Figure 3.
The difference between gene-expression estimates from multi- and single-species array analyses is plotted on the y-axis. Thus, positive values indicate that a greater difference was found in the multispecies analysis than in the single species one, while negative values point to the reverse. Probes are ordered by their log2 expression difference, as estimated from the multispecies analysis (x-axis). (A) Human–human (for which the human and chimpanzee probes were used—mean absolute log2 difference 0.07 ± 0.06) (B) Human–chimp (mean absolute log2 difference 0.18 ± 0.16) (C) Human–orangutan (mean absolute log2 difference 0.24 ± 0.21) (D) Human–rhesus (mean absolute log2 difference 0.25 ± 0.20)