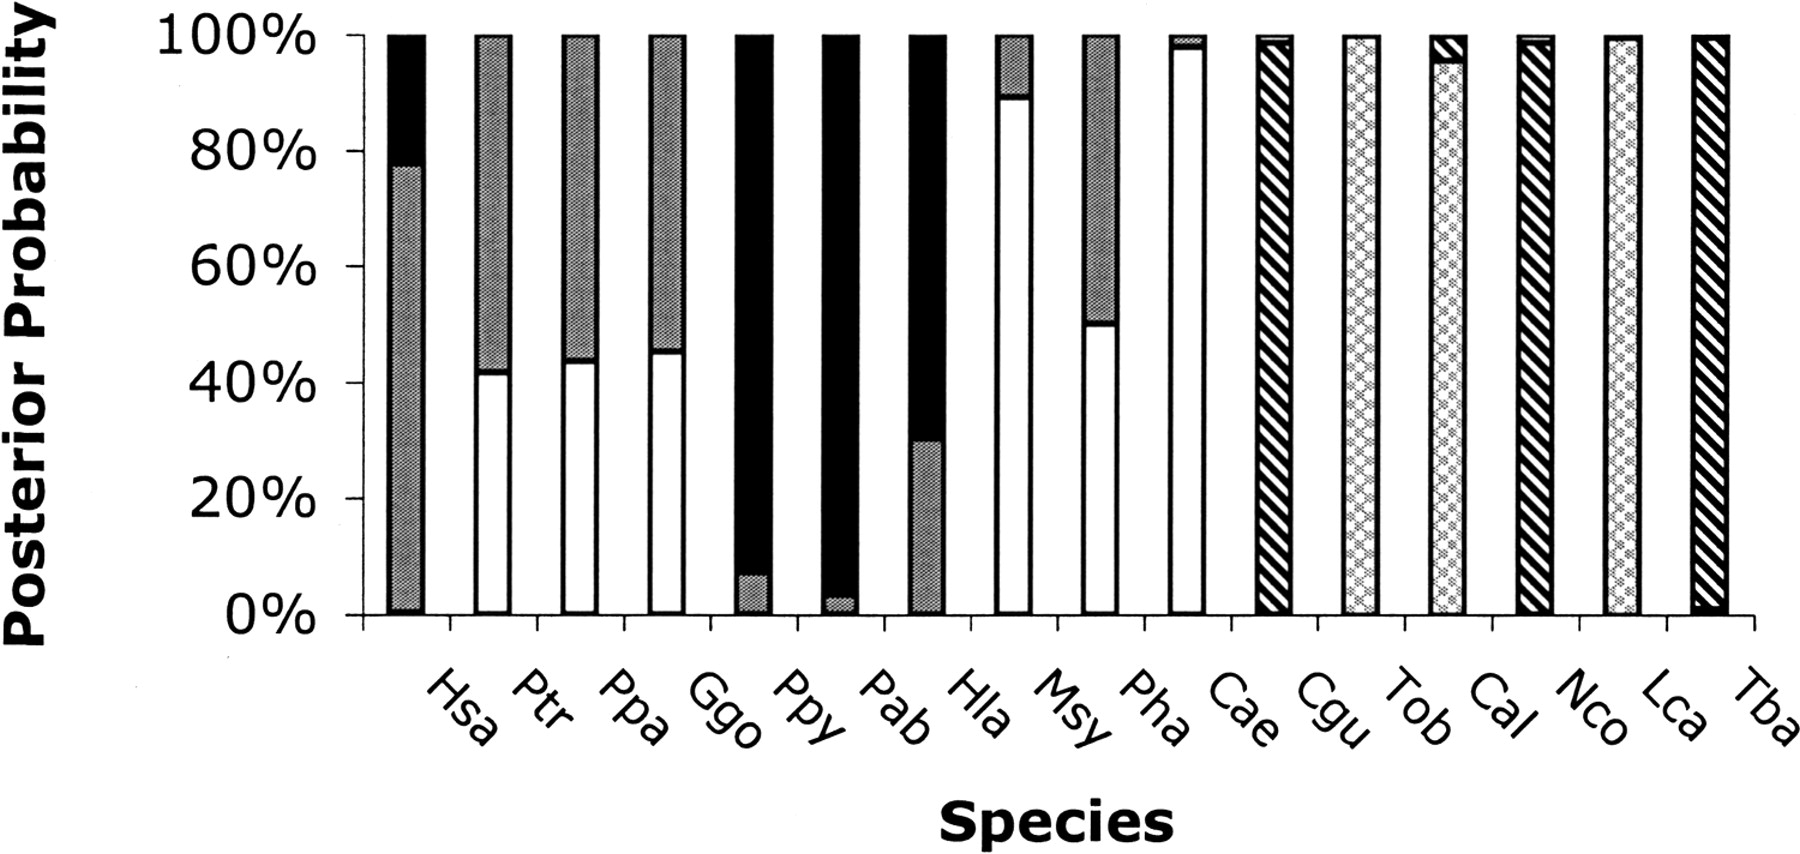
Figure 3.
Posterior probabilities for each species to belong to each model for the five-model mixture. The posterior probabilities are averaged across 10 independent chains. The models in descending order of magnitude of intercept are black (Group S), gray (Group T), white (Group U), diagonal lines (Group V), and gray hatch (Group W). Group identifications are the same as in Figure 2B.