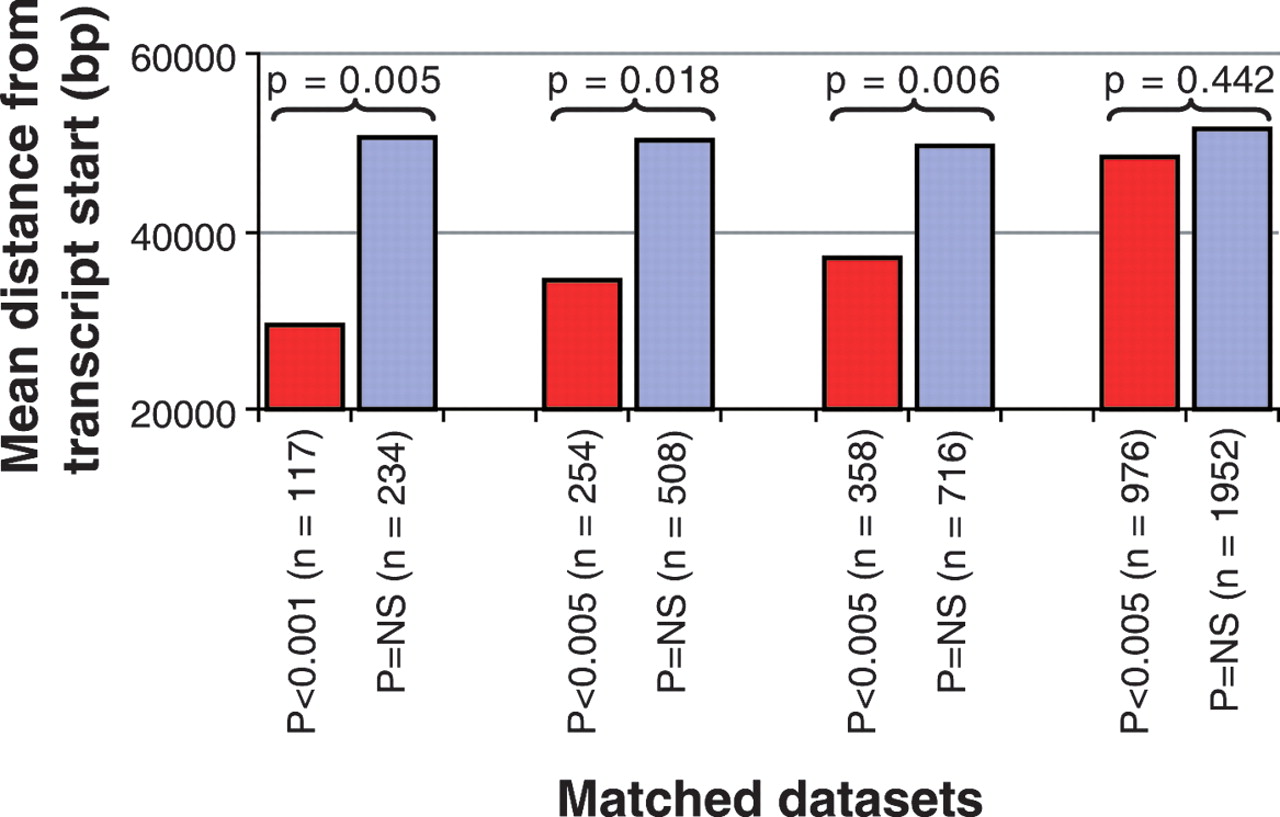
Comparison of SNP-transcript start distances based on significance in EST–genomic allele frequency comparisons. Four pairs of matched (i.e., equal allele frequencies and EST counts) groups of SNPs were compared for distance from transcript start site in the genomic sequence as a proxy for linkage disequilibrium from a putative “regulatory SNP.” The leftmost pair of bars shows mean transcript start site distances for the test set of 117 most significantly (P < 0.001) deviating sets of SNPs (leftmost red bar; also see Table 1) as compared to the control set of 234 matched SNPs showing nonsignificant deviation in EST–genomic allele frequency comparison (leftmost blue bar). The mean distance from the transcript start for the test set is ∼29 kb, which is significantly shorter (t-test, P = 0.005) than the average distance (∼51 kb) observed in the control set. The pairs of bars to the right of the first pair show progressively larger, and less significantly associated, test sets as compared to the two matched sets of controls. The difference in distance between test and control sets diminishes in a stepwise manner: For the test set at P < 0.005, the distance is 34 kb versus 50 kb observed in controls; at P < 0.01, the distance is 37 kb versus 50 kb; and at P < 0.05, the distance is 48 kb versus 52 kb, which is no longer significant.