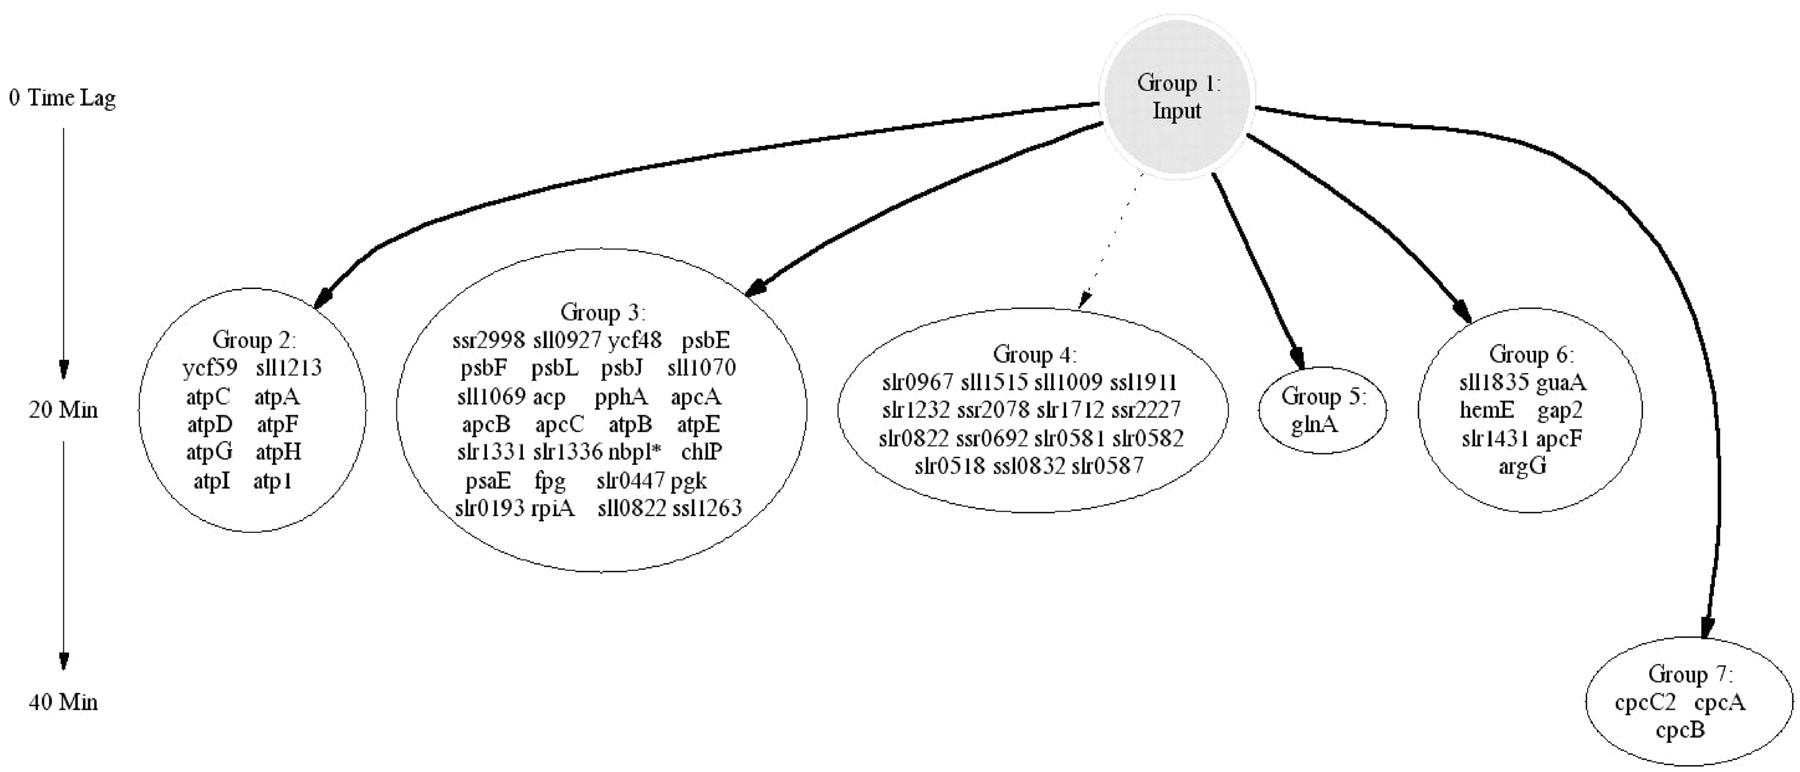
Figure 3
Simplified time-lagged correlation network from Synechocystis sp. PCC6803. The arrows indicate close correlation (|R| > 0.70) between groups, and the corresponding numbers indicate the time lag relative to the input. The network is derived from data from Experiment 1. Dashed lines indicate inverse correlation.