Figure 3
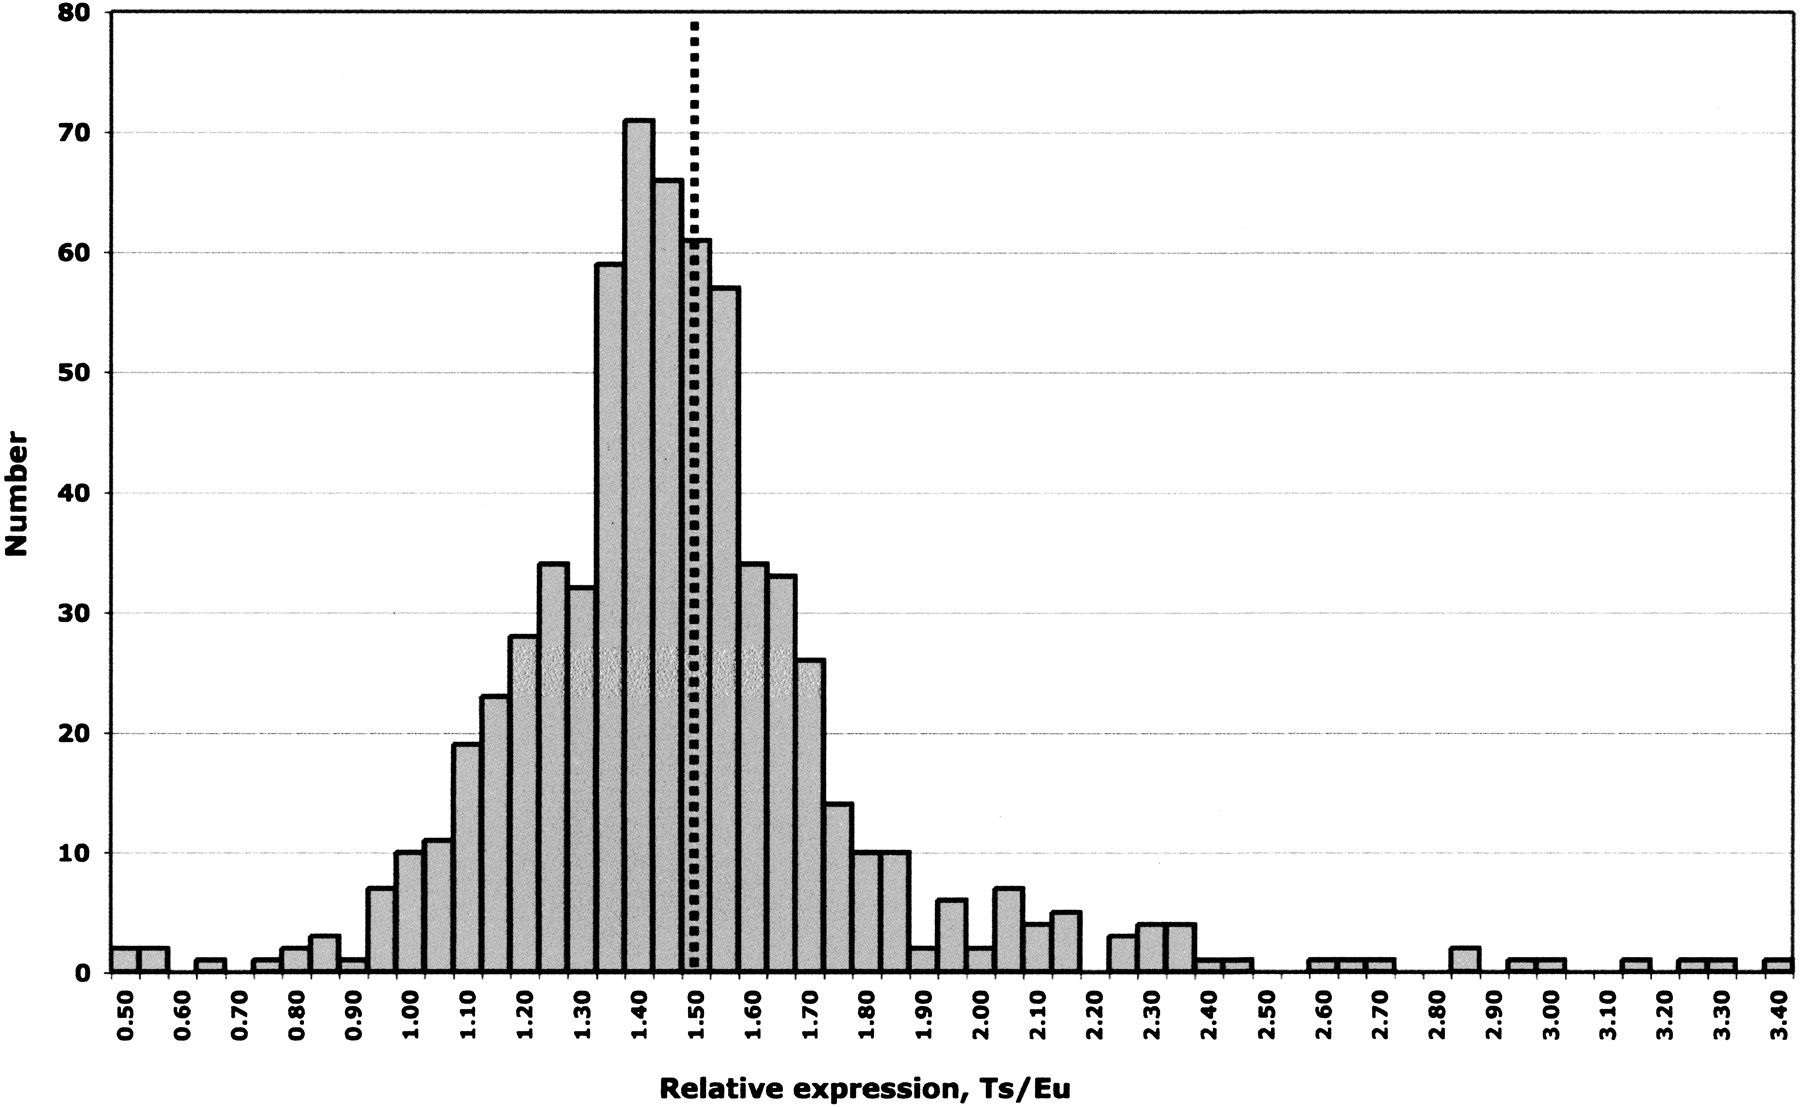
Histogram of normalized relative expression Ts/Eu (xΔe). The values from Figure 2 are plotted into bins differing by 0.05. The dotted line indicates the position of the value 1.5.
Histogram of normalized relative expression Ts/Eu (xΔe). The values from Figure 2 are plotted into bins differing by 0.05. The dotted line indicates the position of the value 1.5.