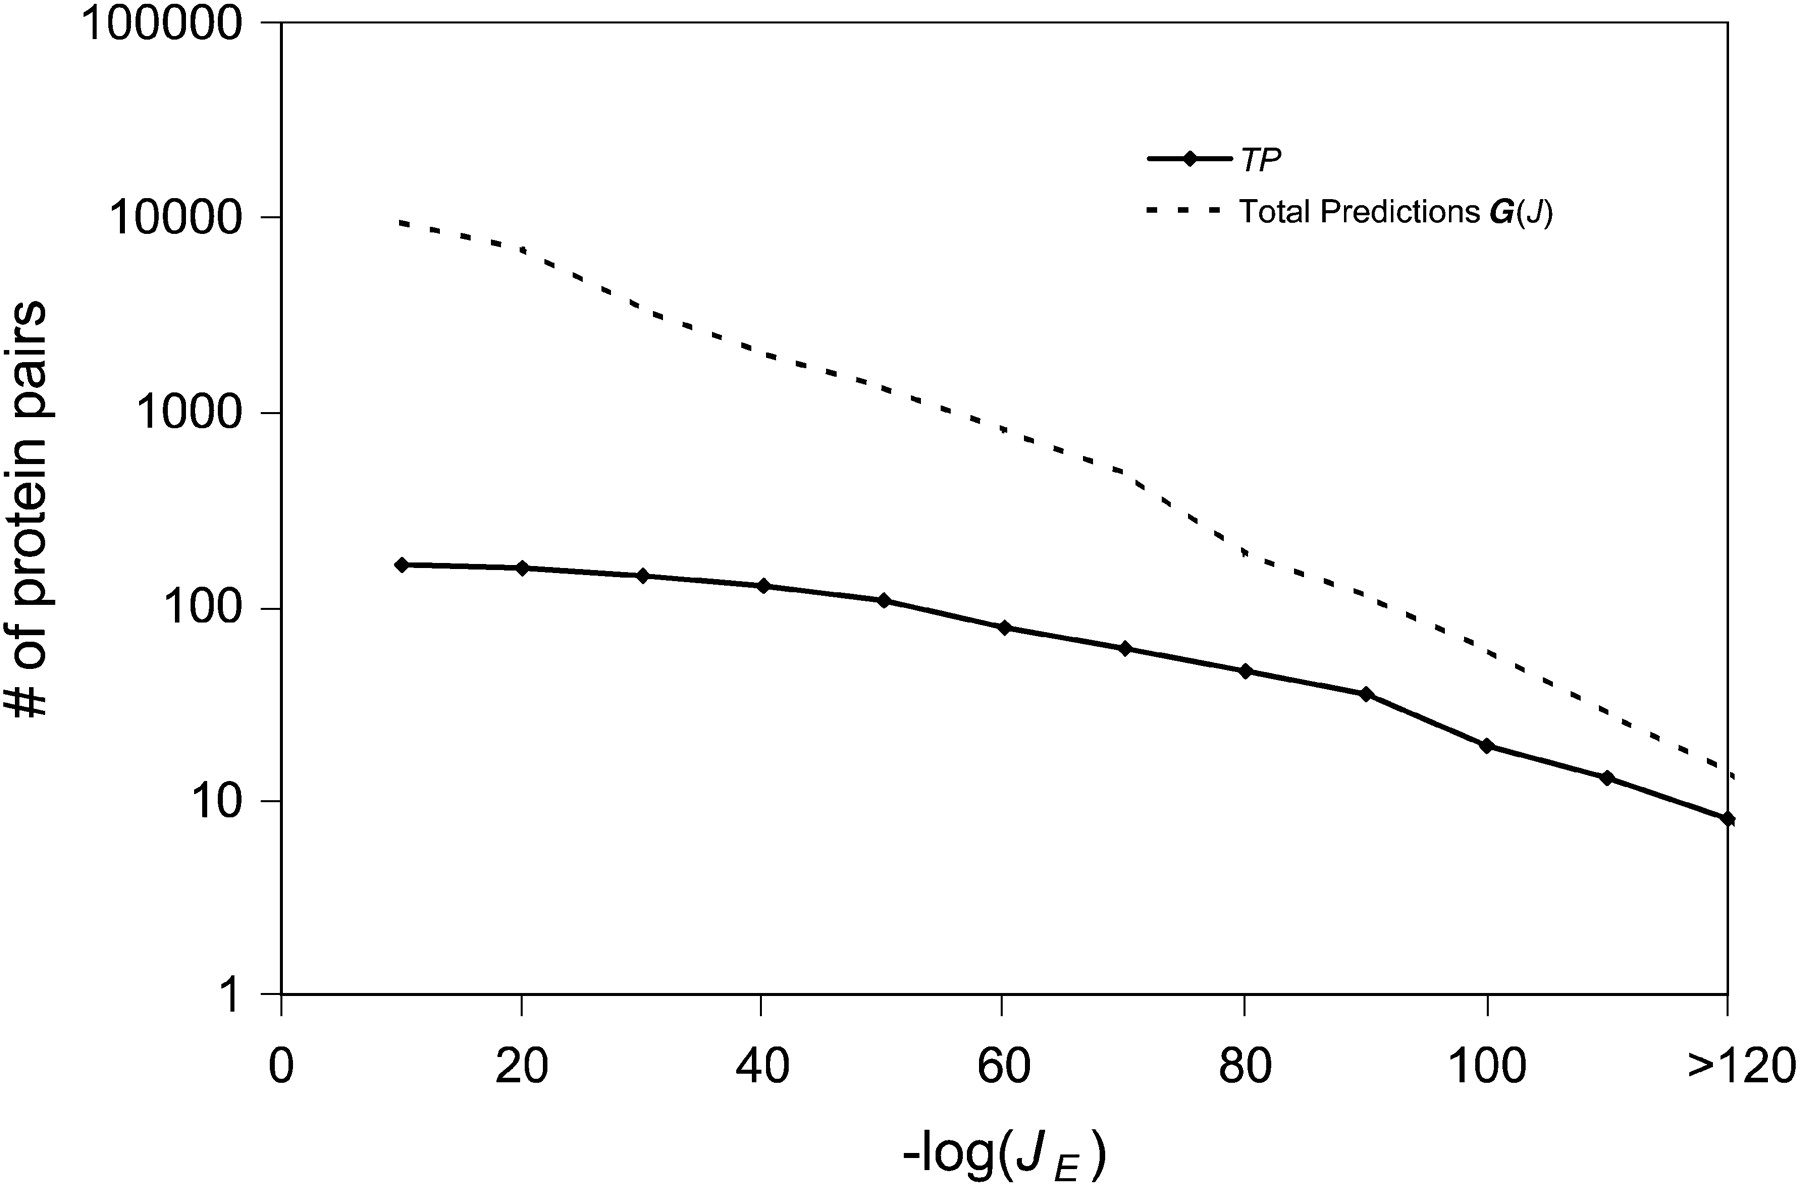
Figure 3
Distribution of the number of generalized interologs as a function of joint E-value (JE). The dashed line represents the number of all predictions above a given JE, that is, G(J). The solid line represents the number of true positives above a given JE, that is, TP.