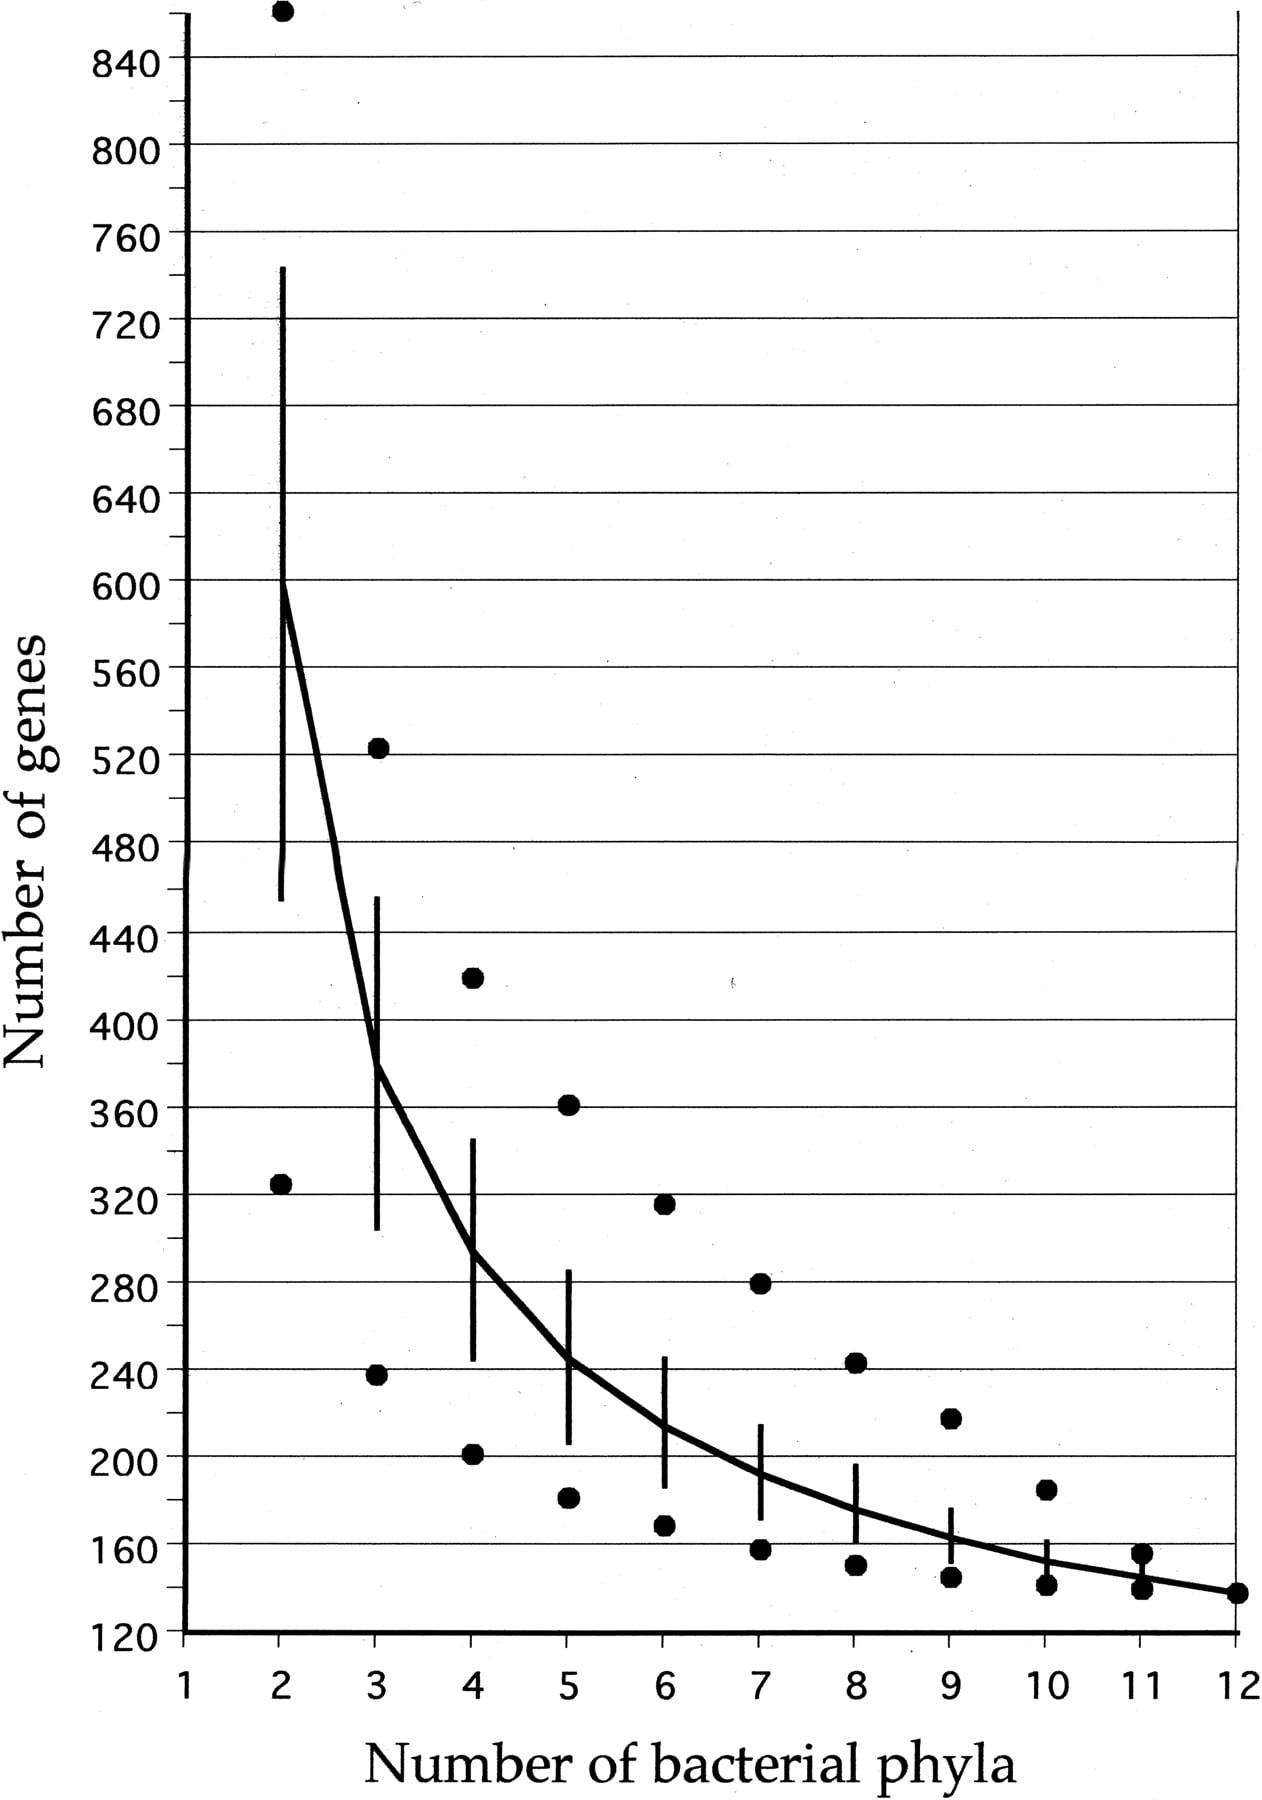
Figure 3.
Graphical representation of Table 4. The x-axis denotes breadth of distribution amongst bacterial phyla, whereas the y-axis indicates the mean number of orthologs (reciprocal best matches) shared at that breadth. (Vertical bars) SD; (dots) minima and maxima.