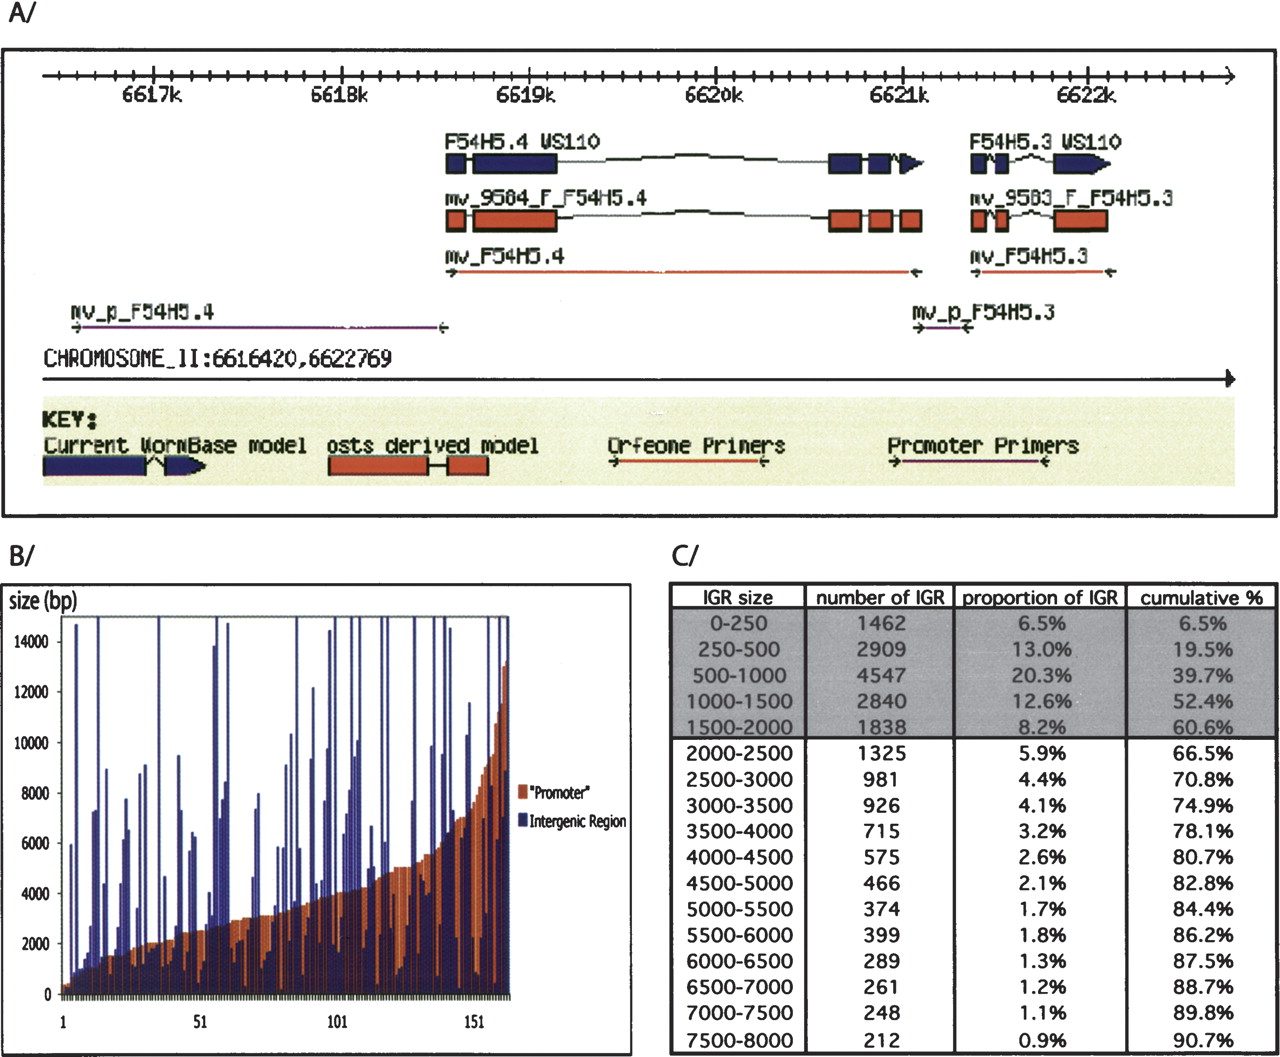
Defining C. elegans promoterome. (A) Illustration of our Intergenic region (IGR) cloning strategy. Primers have been designed to amplify the entire IGR when smaller than 2 kb (F54H5.3), the first 2 kb of the IGR when bigger than 2 kb (F54H5.4), or 300 bp when smaller than 300 bp. (B) Analysis of previously published “promoters.” We randomly selected 200 publications containing a gene expression pattern determined by translational or transcriptional fusion. When available (164/200) we retrieved the length of the upstream DNA fragment (“promoter”) that was used to drive the observed expression. The sizes of the analyzed region range from 300 bp to 13 kb and mostly represent the distance to the closest convenient restriction site. In many cases a fraction of the IGR was successfully used. (C) IGR sizes in C. elegans genome. For each predicted ORF of the C. elegans genome (WS93) the IGR size was calculated as the distance between the ORF's predicted ATG and the closest extremity of the next upstream ORF. For each range of sizes the number of IGR in that range, its proportion in the genome and the cumulated proportion are indicated.