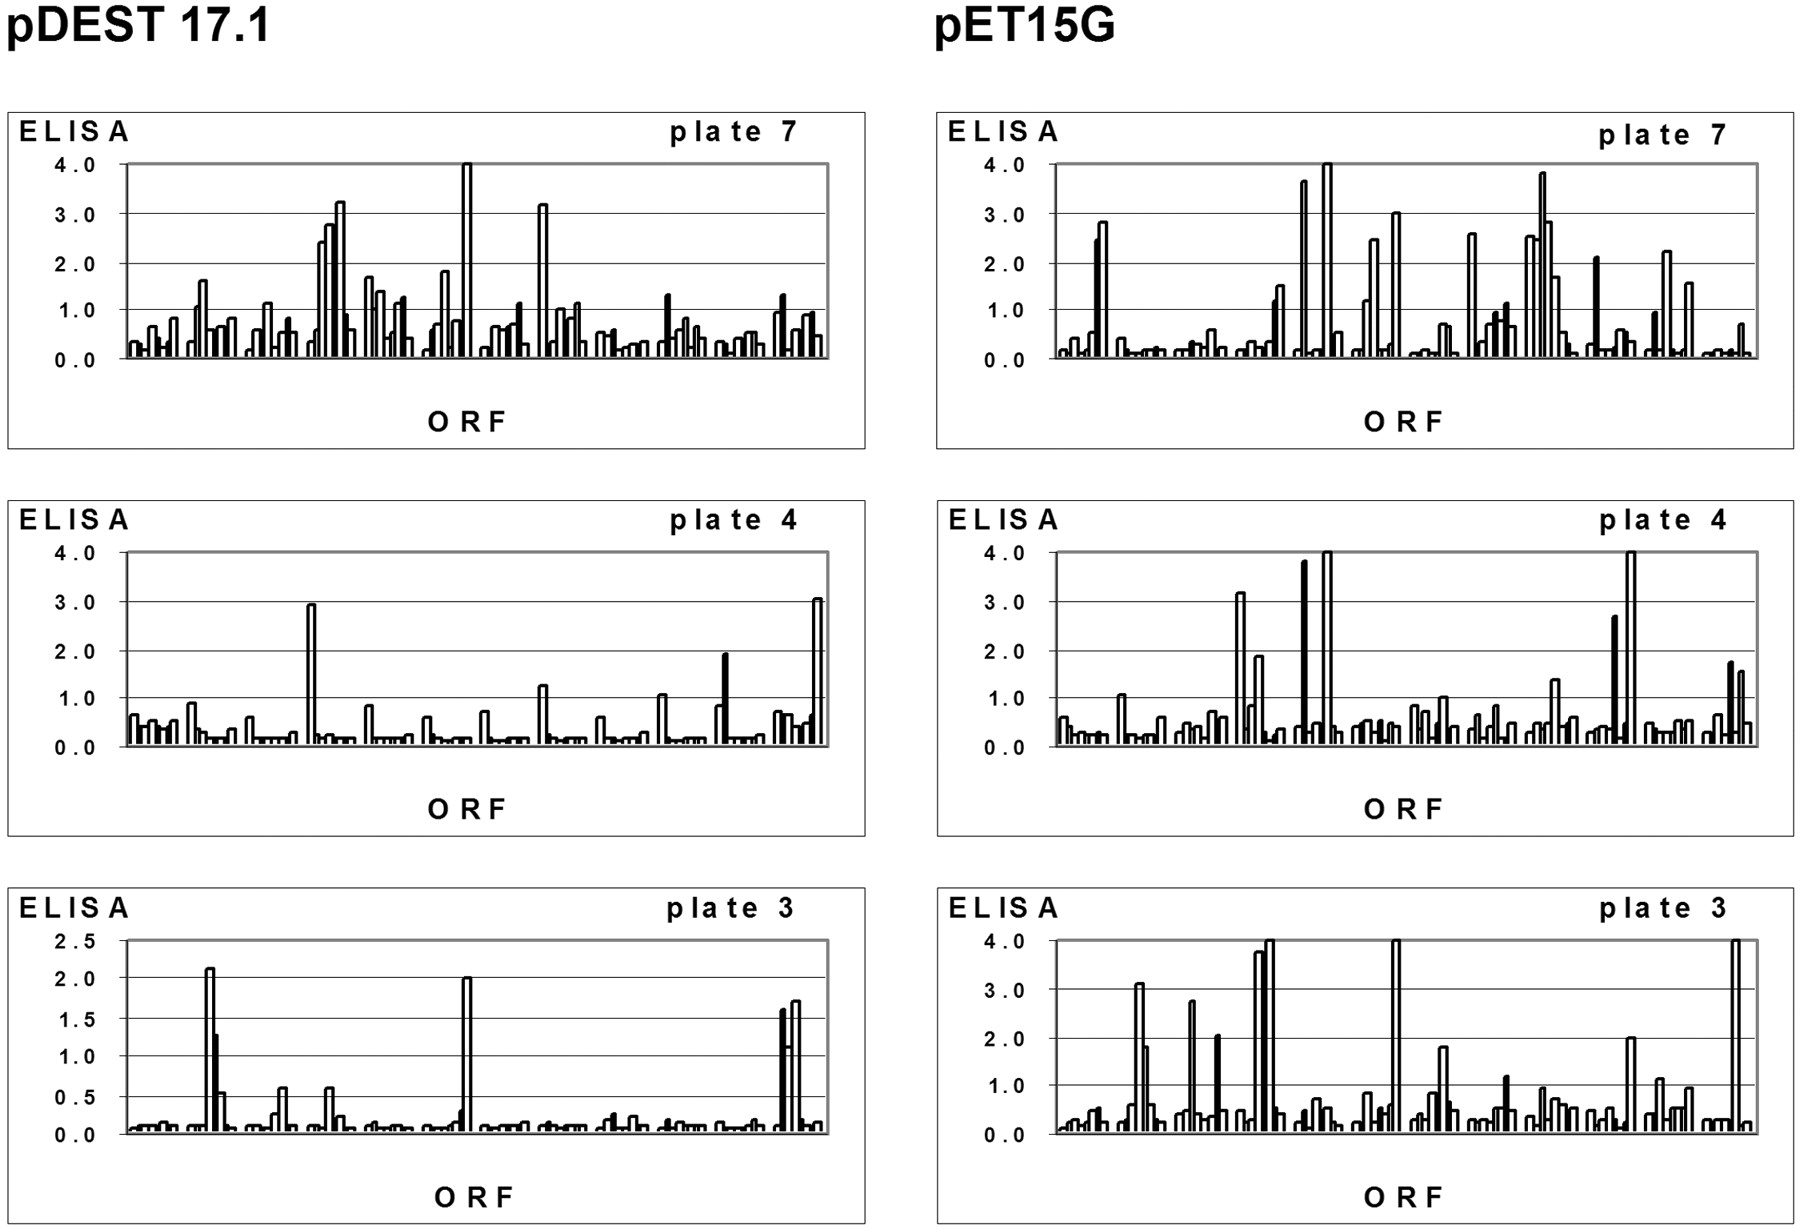
Figure 3
Comparison of expression vector pDEST17.1 vs. pET15G for protein expression. Protein expression of the genes in the four plates was carried out using pDEST17.1 (plots on left) and pET15G (plots on right). The number of soluble proteins was increased in all cases by using pET15G. The data are represented as histograms of OD readings at 405 nm from ELISA vs. ORFs in the 96-well plate.