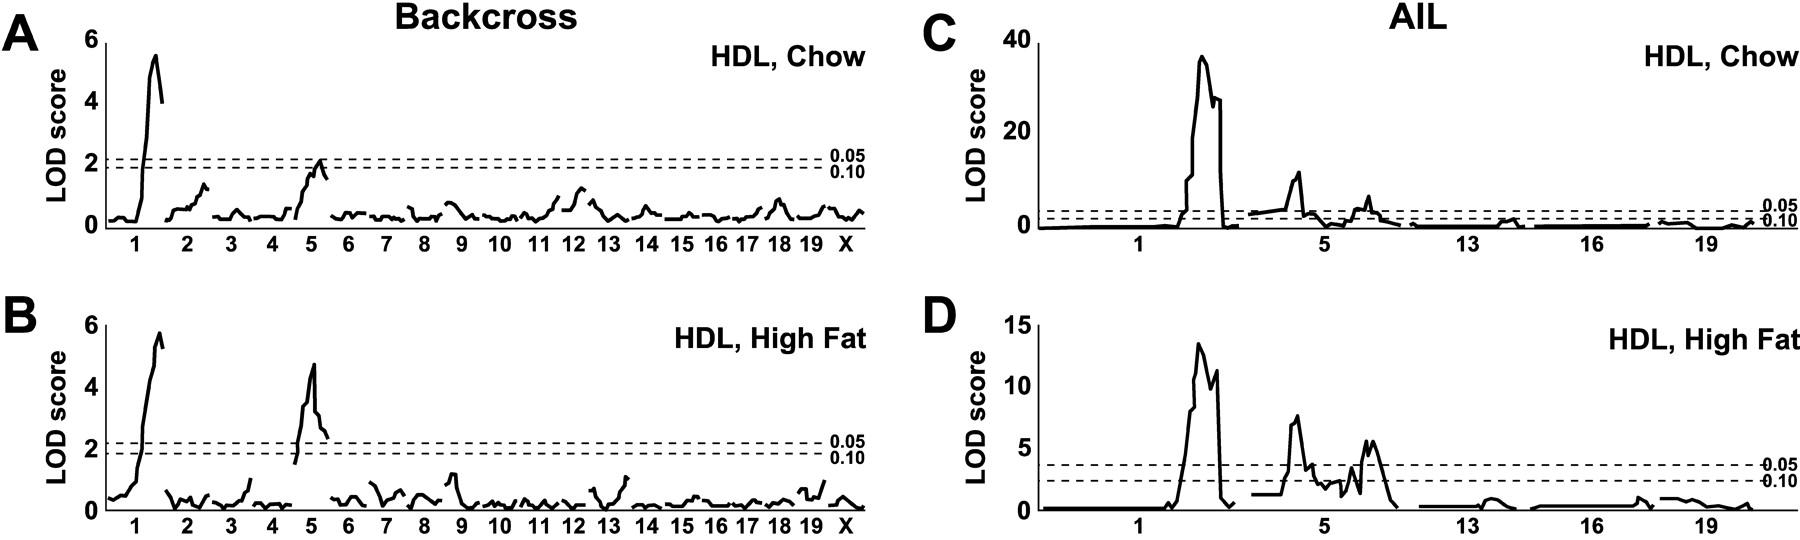
Figure 3
Genome scans for HDL concentrations in (B6 × NZB)F1 × B6 backcross progeny fed chow (A) and high-fat diet for 4 weeks (B), and HDL concentrations in the (B6 × NZB)F11 AIL progeny fed chow (C) and a high-fat diet for 6 weeks (D). The Y-axis indicates LOD ratio scores, and the X-axis indicates chromosome positions. Horizontal lines indicate suggestive (P < 0.10) and significant (P < 0.05) thresholds, calculated by permutation tests.