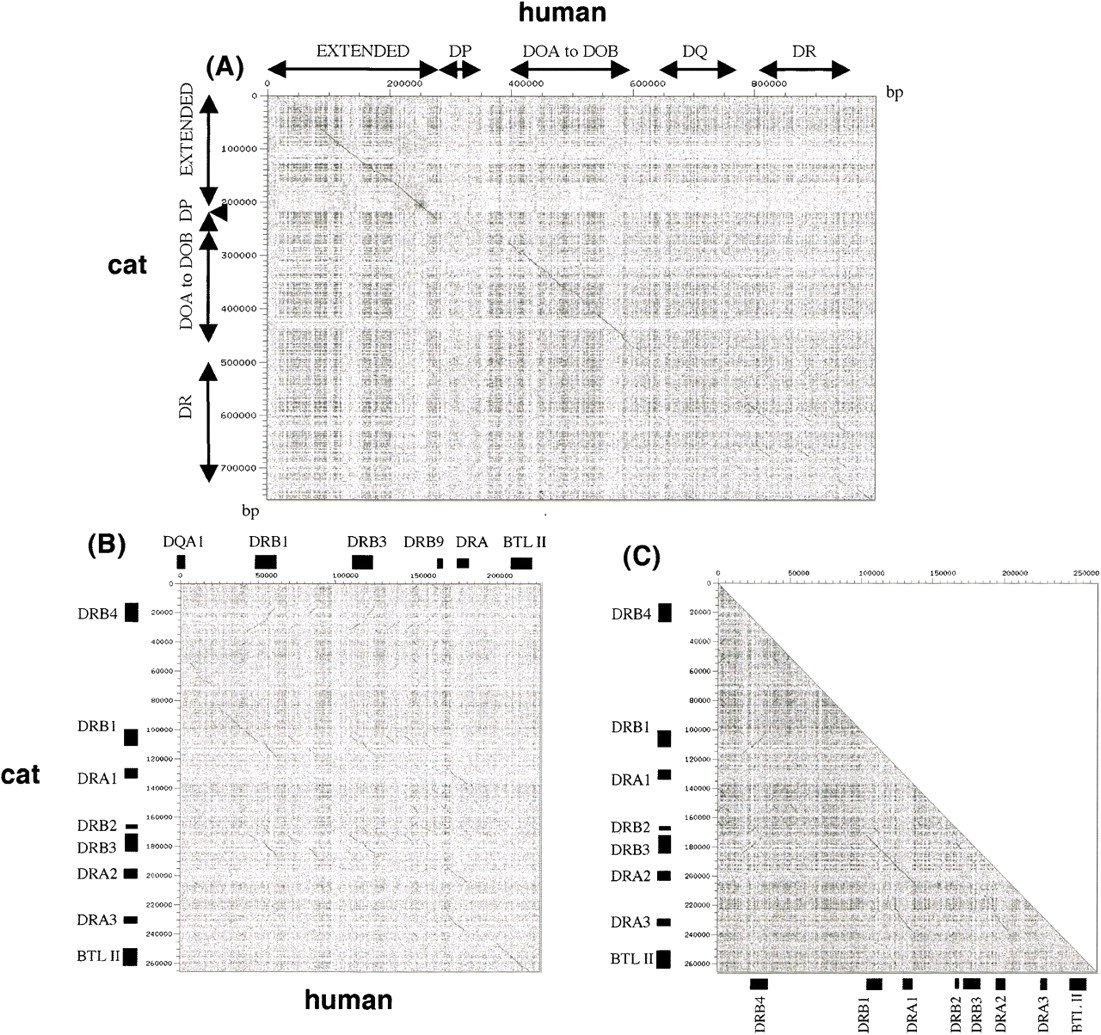
Figure 3
(A) Dotter dot plot comparisons (Sonnhammer and Durbin 1995): human MHC class II sequence (997,836 bp, horizontal) vs. domestic cat MHC class II sequence (758,291 bp, vertical). Arrow bars indicate positions of each subregion. Lines with 45° angle indicate homologous sequence stretches between human and cat class II sequences with a same/reverse orientation. (B) Human DR subregion sequence (235 kb, horizontal) vs. cat DR subregion sequence (266 kb, vertical). (C) Self-sequence analysis in cat DR subregion to identify large repeat sequences, including gene duplication.