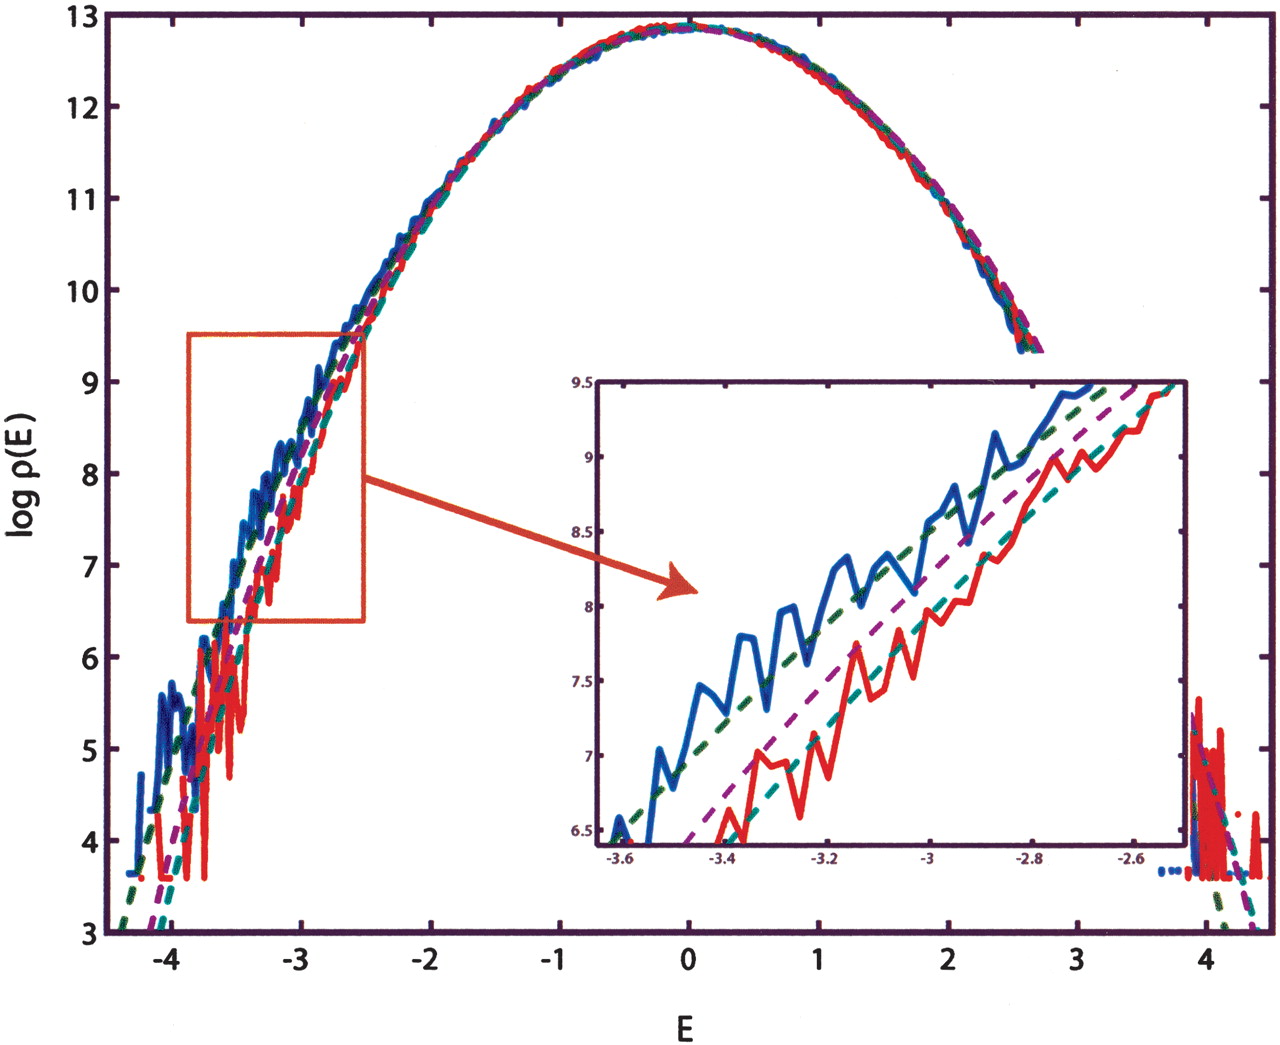
This figure illustrates the importance of the correlation effects in genomic background statistics. The histograms of binding energies are obtained for a randomly chosen ϵ vector (blue) and its scrambled, that is, position-permuted, version [TeX:] \batchmode \documentclass[fleqn,10pt,legalpaper]{article} \usepackage{amssymb} \usepackage{amsfonts} \usepackage{amsmath} \pagestyle{empty} \begin{document} \({\tilde{{\varepsilon}}}\) \end{document} (red). The magenta curve is the theoretical estimate of the binding energy distribution based on a random nucleotide model without correlations, but with the correct one-point statistics of bases. That estimate is the same for ϵ and [TeX:] \batchmode \documentclass[fleqn,10pt,legalpaper]{article} \usepackage{amssymb} \usepackage{amsfonts} \usepackage{amsmath} \pagestyle{empty} \begin{document} \({\tilde{{\varepsilon}}}\) \end{document} . The theoretical energy distribution for model background statistics, which includes correct one- and two- (nearest-neighbor) base statistics, is different for ϵ and [TeX:] \batchmode \documentclass[fleqn,10pt,legalpaper]{article} \usepackage{amssymb} \usepackage{amsfonts} \usepackage{amsmath} \pagestyle{empty} \begin{document} \({\tilde{{\varepsilon}}}\) \end{document} (green curves) is in a much better agreement with the empirical histograms.