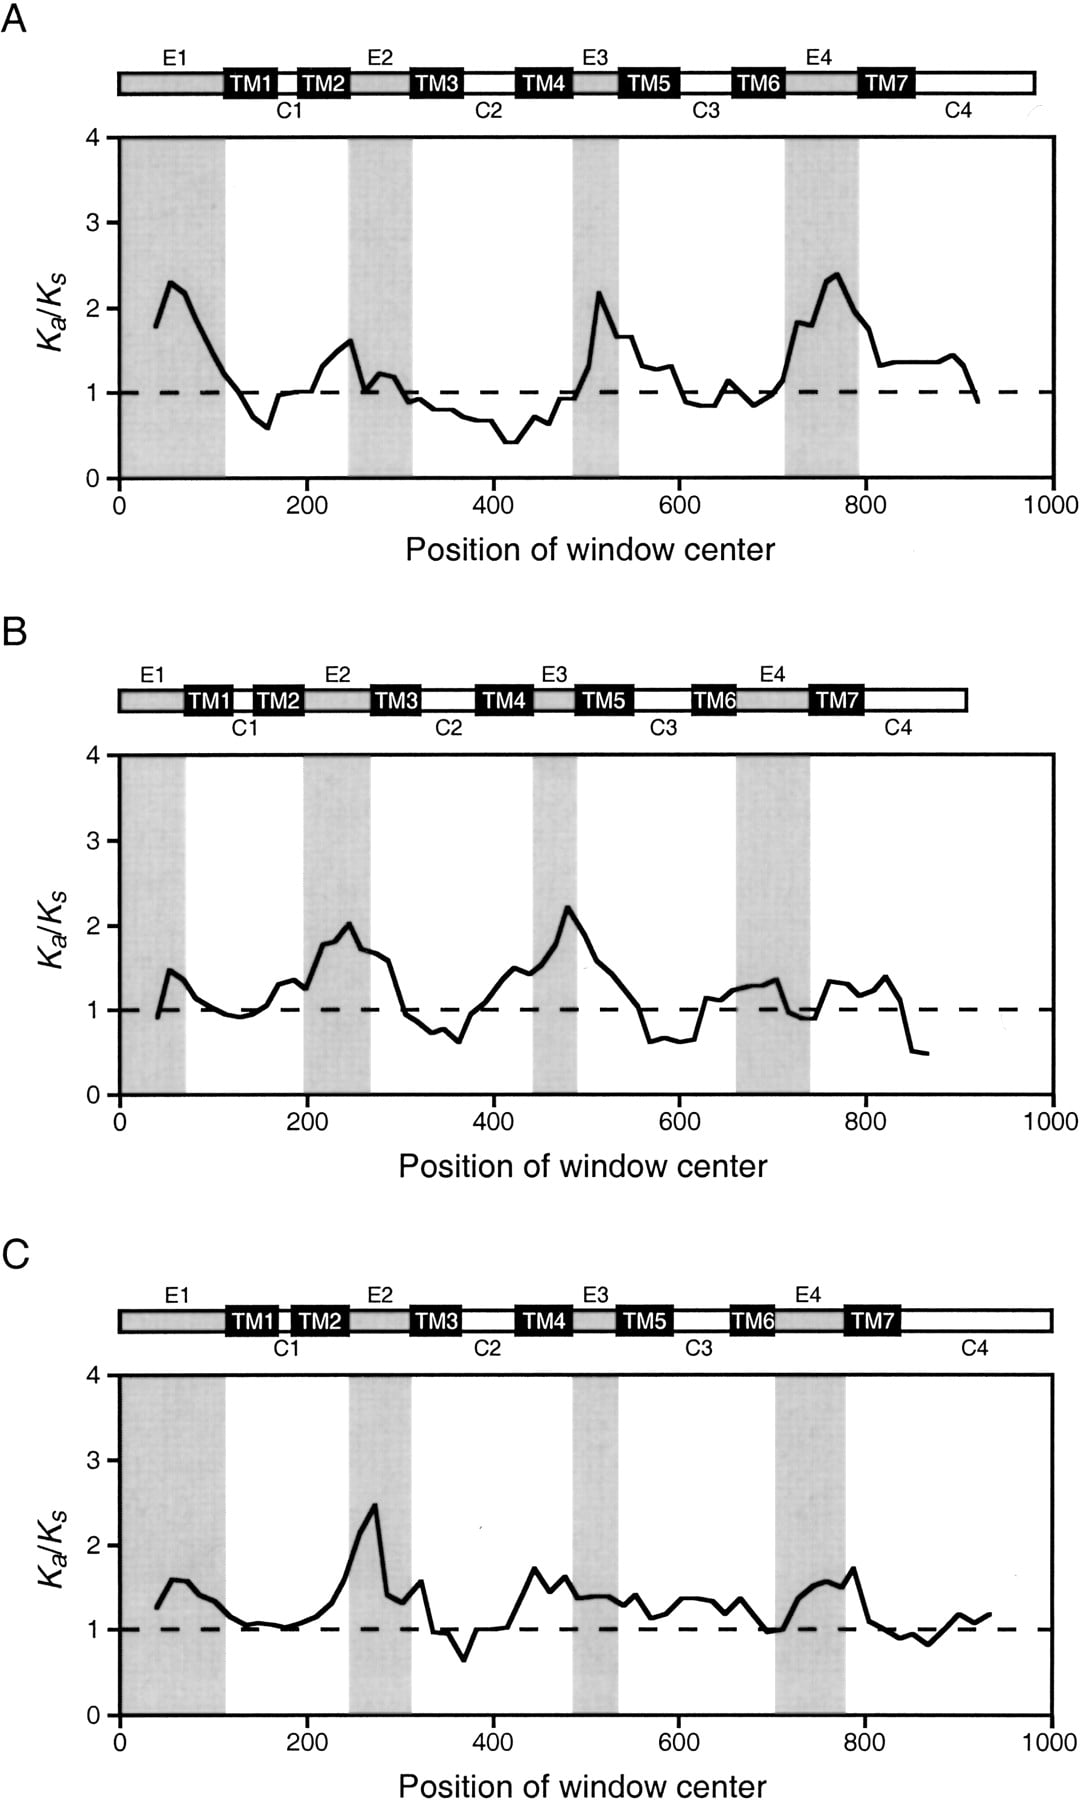
Figure 3
Sliding-window analysis of Ka/Ks performed on MRGX (A), murine MrgA (B), and murine MrgB (C), where Ka and Ks were the sum divergence values across all segments of the corresponding phylogenetic tree.
Sliding-window analysis of Ka/Ks performed on MRGX (A), murine MrgA (B), and murine MrgB (C), where Ka and Ks were the sum divergence values across all segments of the corresponding phylogenetic tree.