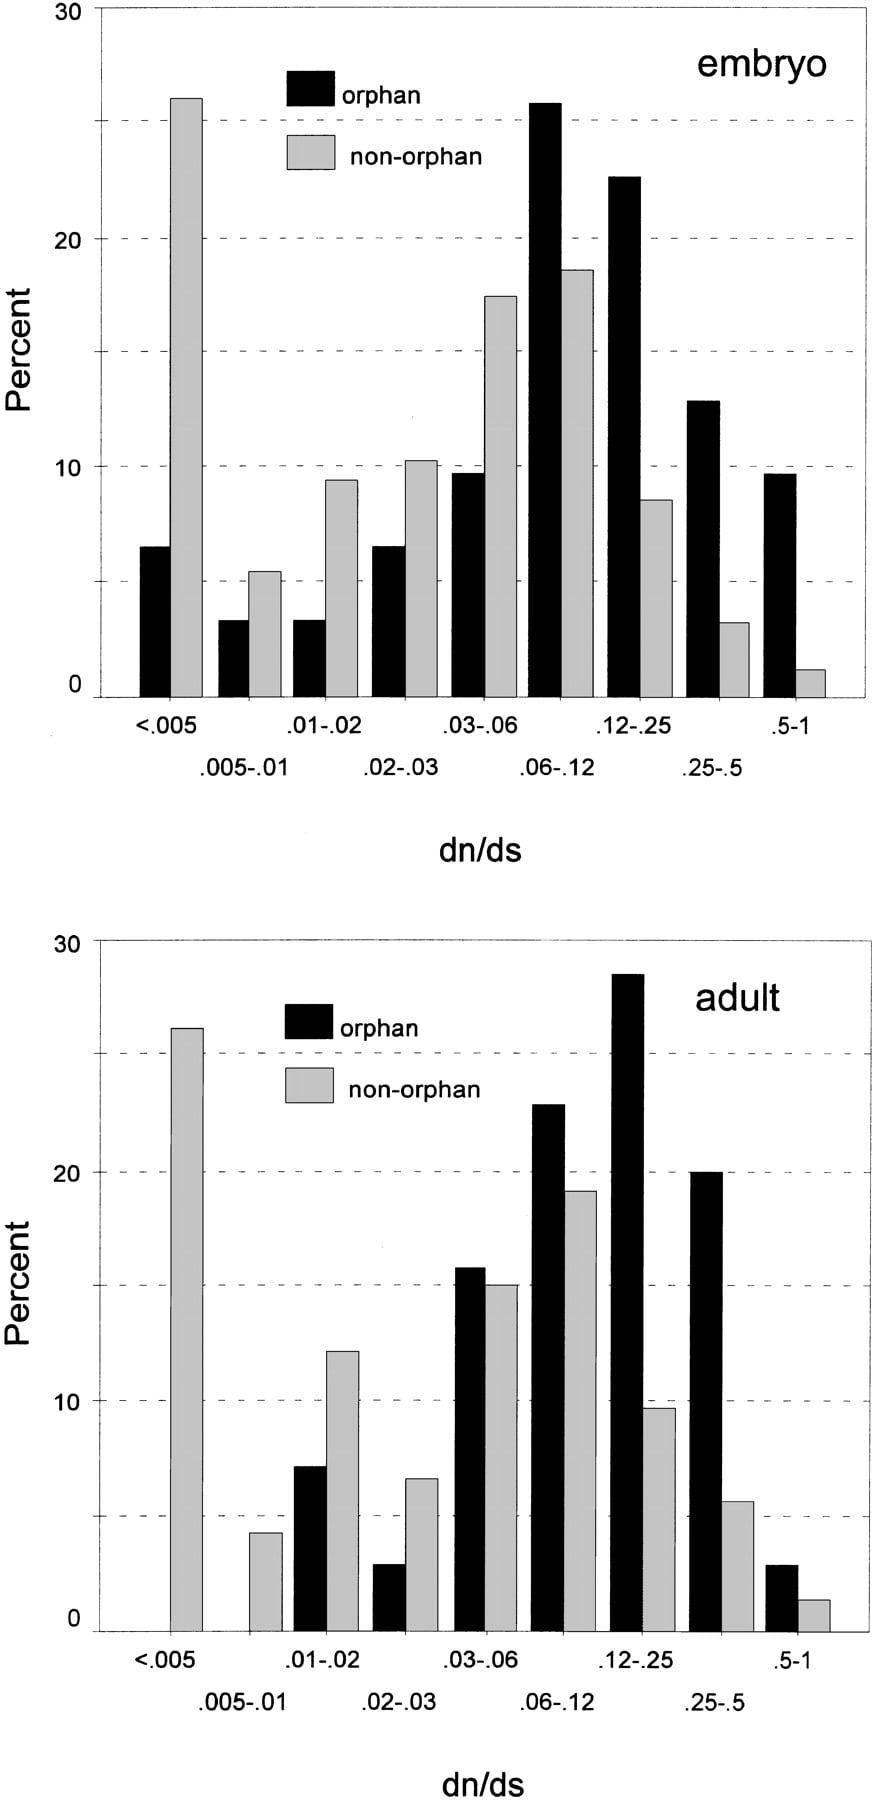
Figure 3
Discrete distribution of dN/dS ratios for the embryo (top) and the adult (bottom) library. The percentage of genes falling into the respective dN/dS value classes are represented by black (orphans) and gray (nonorphans) columns. Similar distribution patterns are obtained for dN alone (data not shown). Note the logarithmic scale for representing the dN/dS ratio classes.