Figure 2.
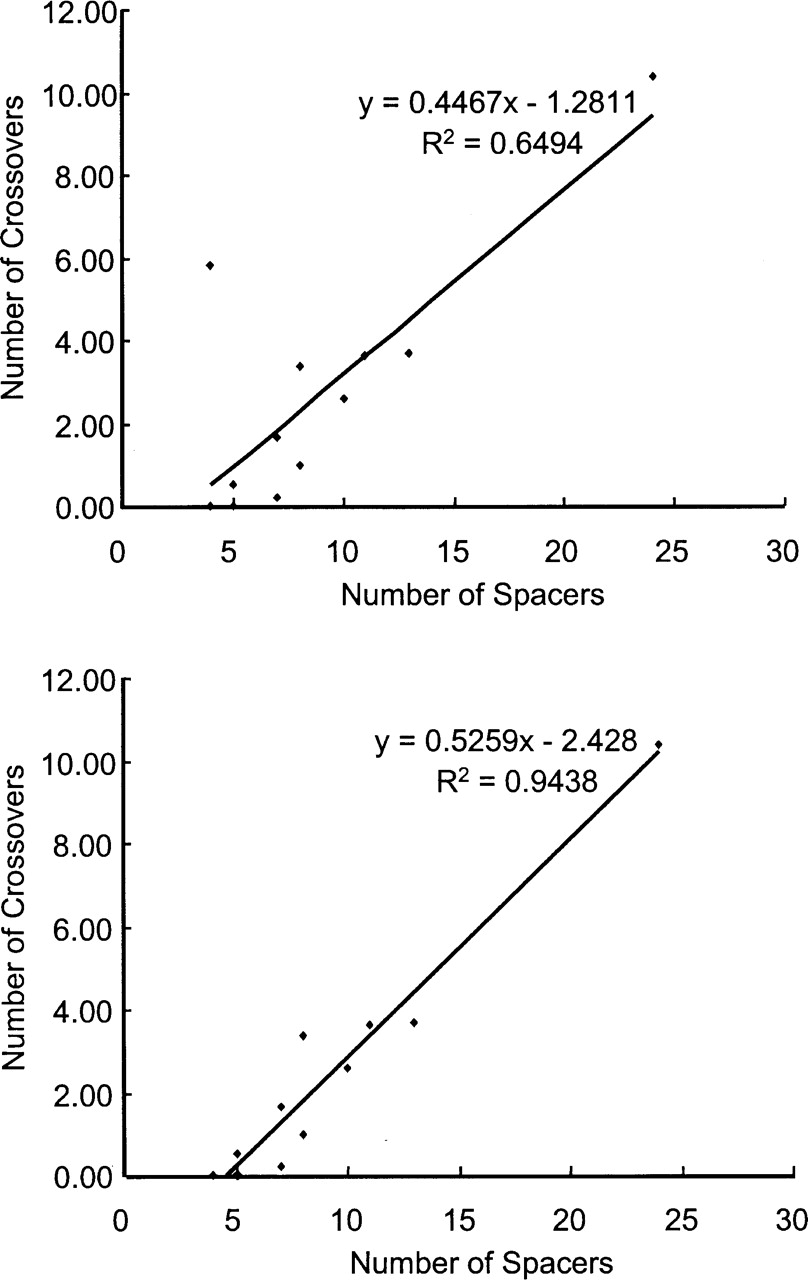
Correlation between the number of crossovers and the number of spacers in the 13 areas, A1-A13. (Top) Plot including A2; (bottom) plot excluding A2 from the correlation analysis.
Correlation between the number of crossovers and the number of spacers in the 13 areas, A1-A13. (Top) Plot including A2; (bottom) plot excluding A2 from the correlation analysis.