Figure 2.
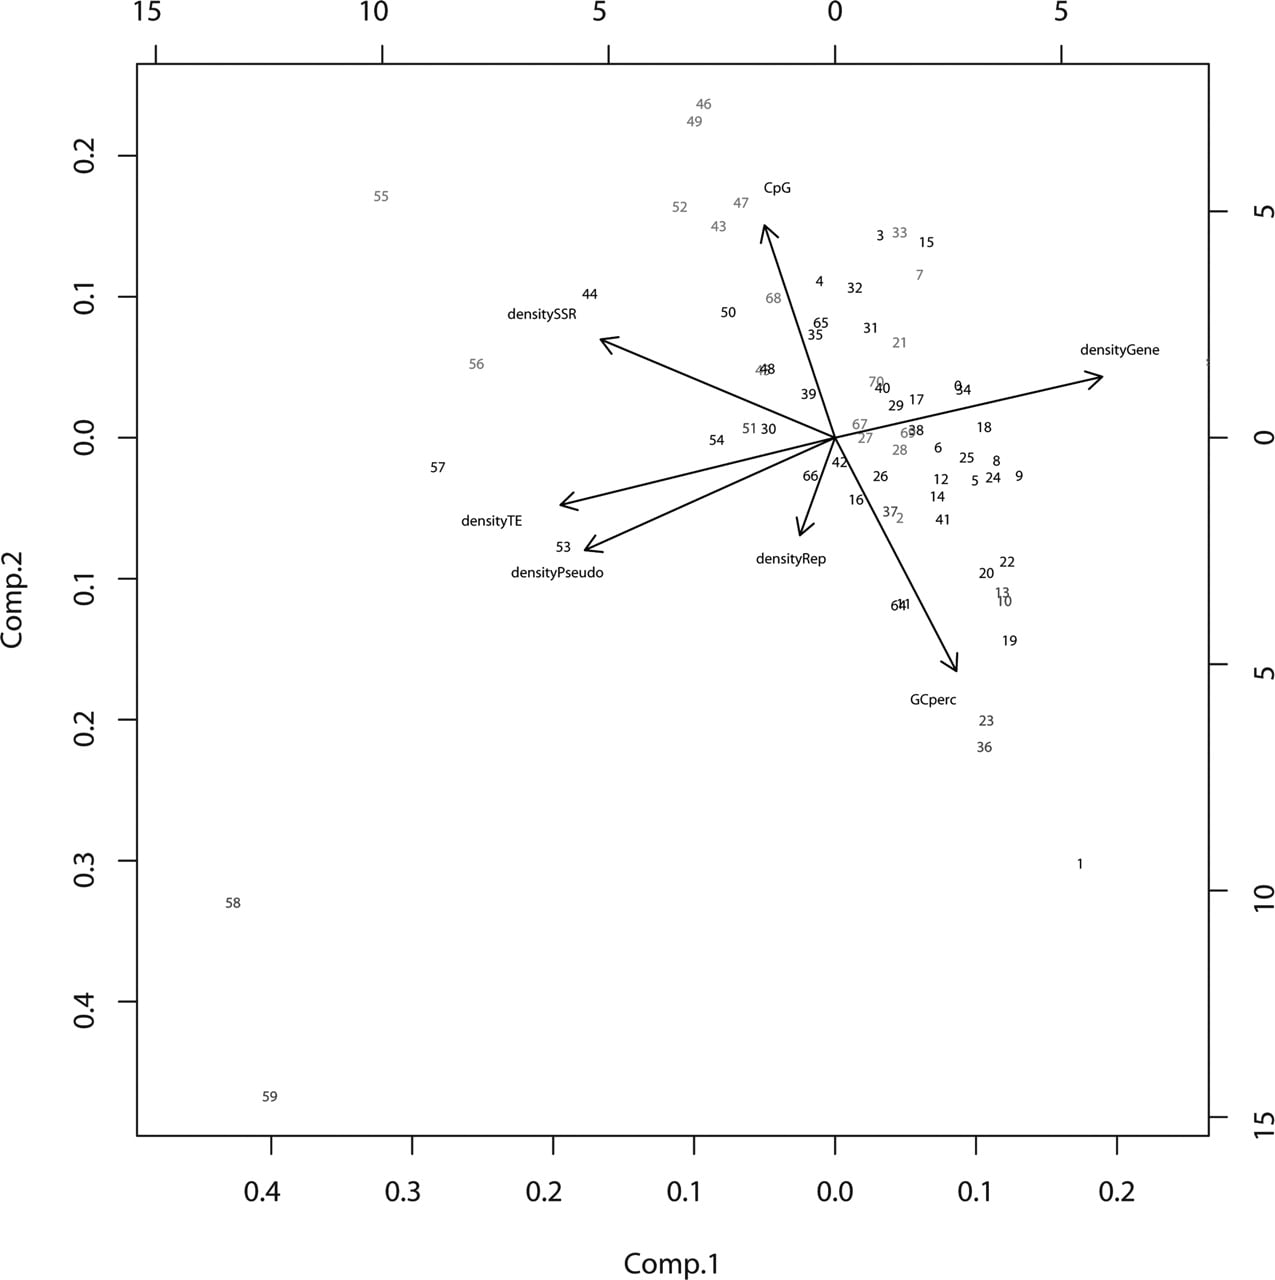
Principal component analysis of chromosome 4 of A. thaliana. Numbers refer to the intervals given in Figure 1 and Supplemental Table 2. Hot intervals are indicated in red; cold intervals are indicated in blue.
Principal component analysis of chromosome 4 of A. thaliana. Numbers refer to the intervals given in Figure 1 and Supplemental Table 2. Hot intervals are indicated in red; cold intervals are indicated in blue.