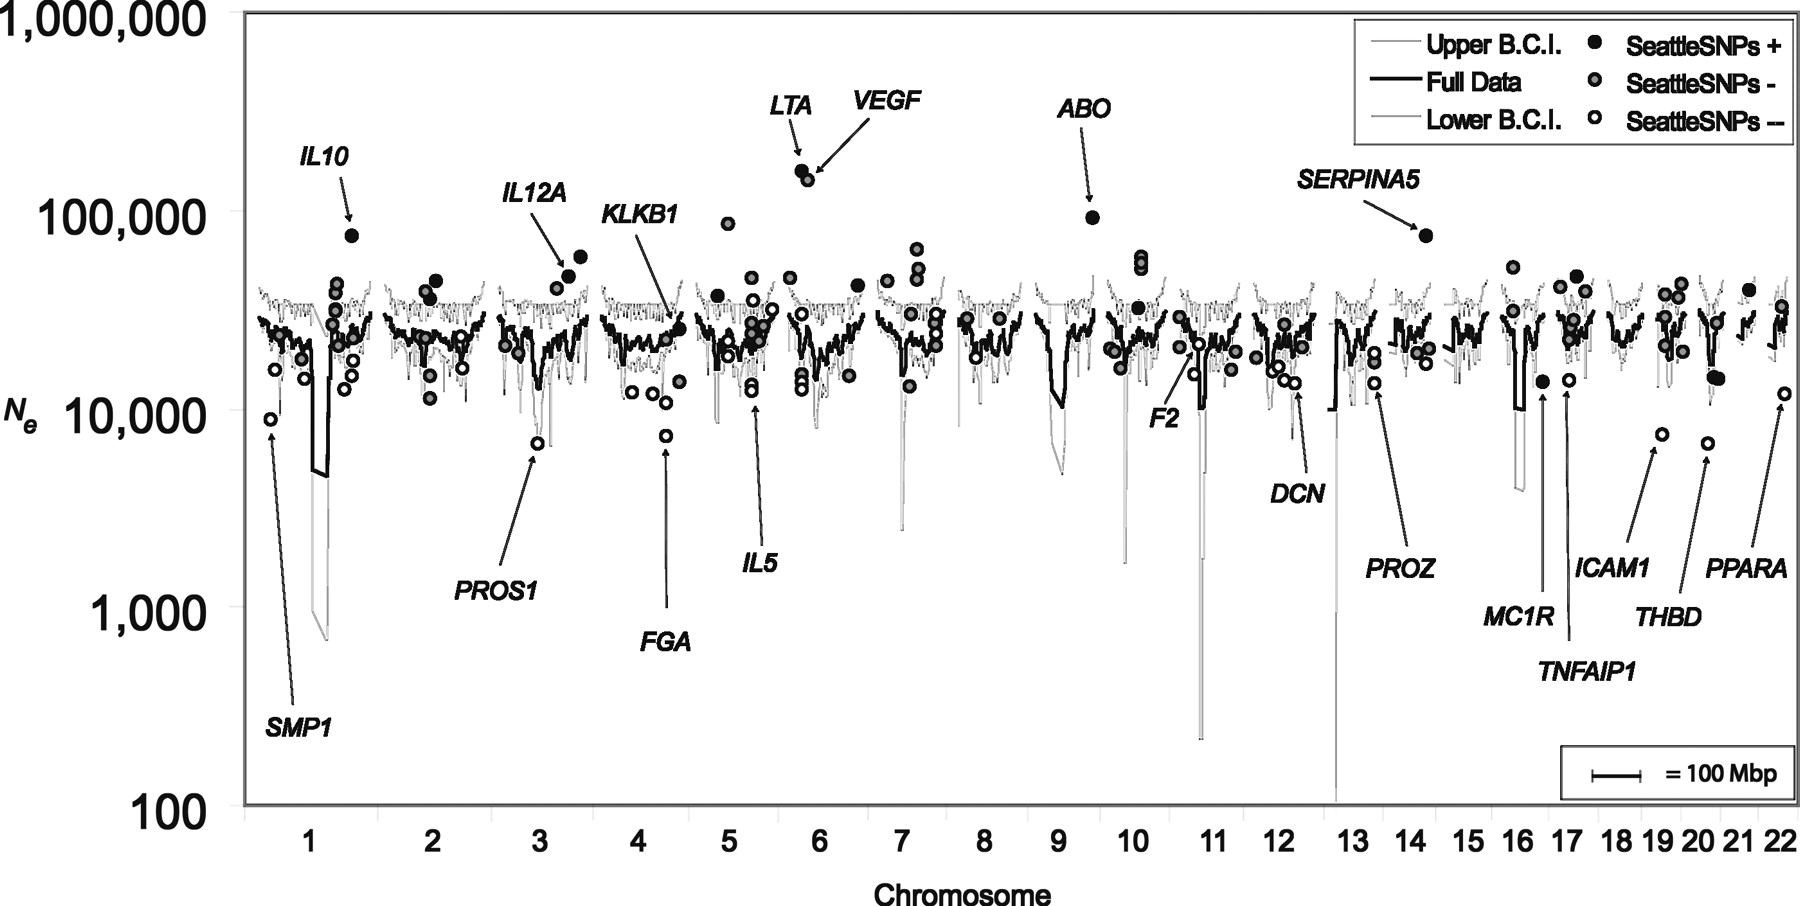
Figure 2.
Predicted (lines) and estimated (circles) effective population size estimates (Ne) along the human autosomes under the model of background selection (equation 2). The upper and lower 90% bootstrapping-based confidence intervals are solely for the background-selection estimates. The deviations of individual gene regions depend on evolutionary variance and their individual sampling properties. Filled black circles correspond to positive Tajima's D values, filled gray circles correspond to Tajima's D values between 0 and -1; filled white circles correspond to Tajima's D values <-1.