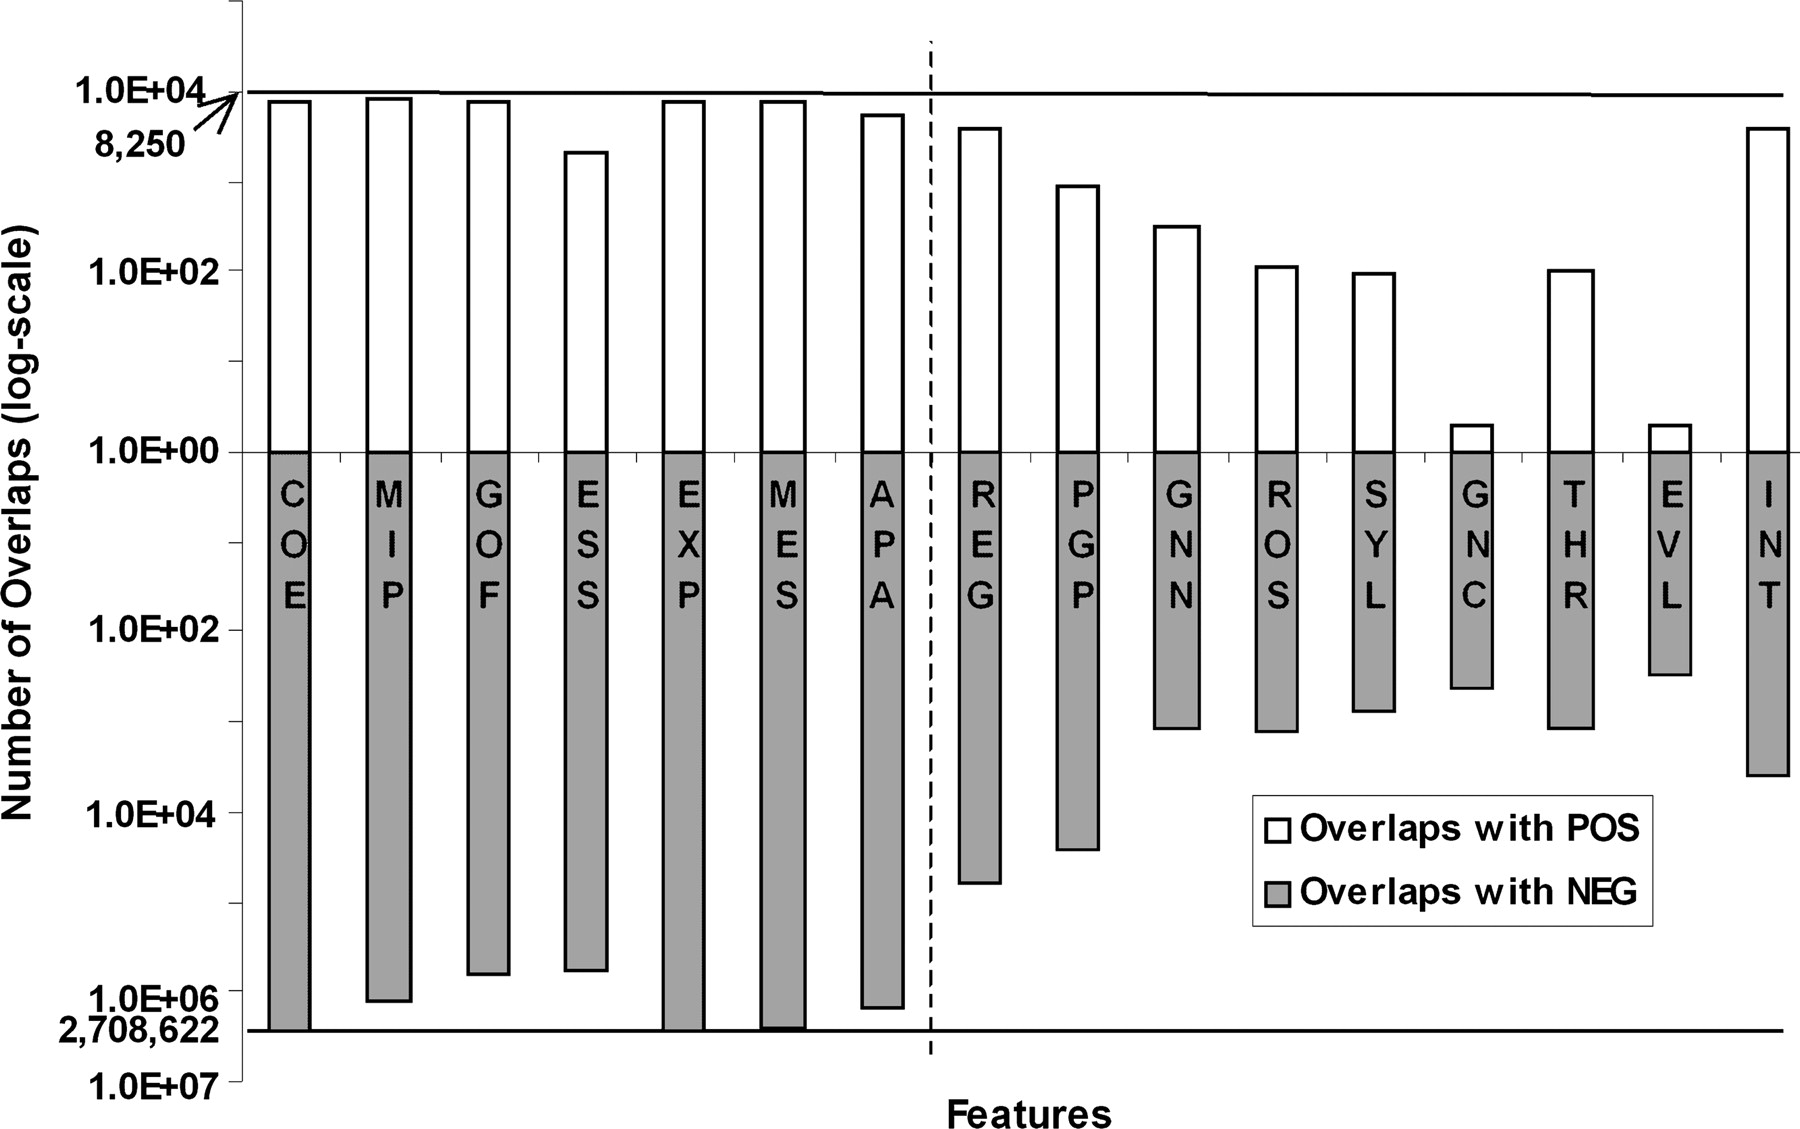
Figure 2.
Overlaps between features and GSTDs. The blank and shaded columns represent the size of overlaps between the 16 features and the GSTD+ and GSTD–, respectively. The total numbers of protein pairs in the GSTD+ (8250) and GSTD– (2,708,622) are marked by two horizontal lines. Each of the seven features to the left of the dashed divider has at least 20% coverage of the GSTDs (positive and negative combined). Note that the plot is in log-scale; therefore, the APA column actually represents 23 times more protein pairs than REG column.