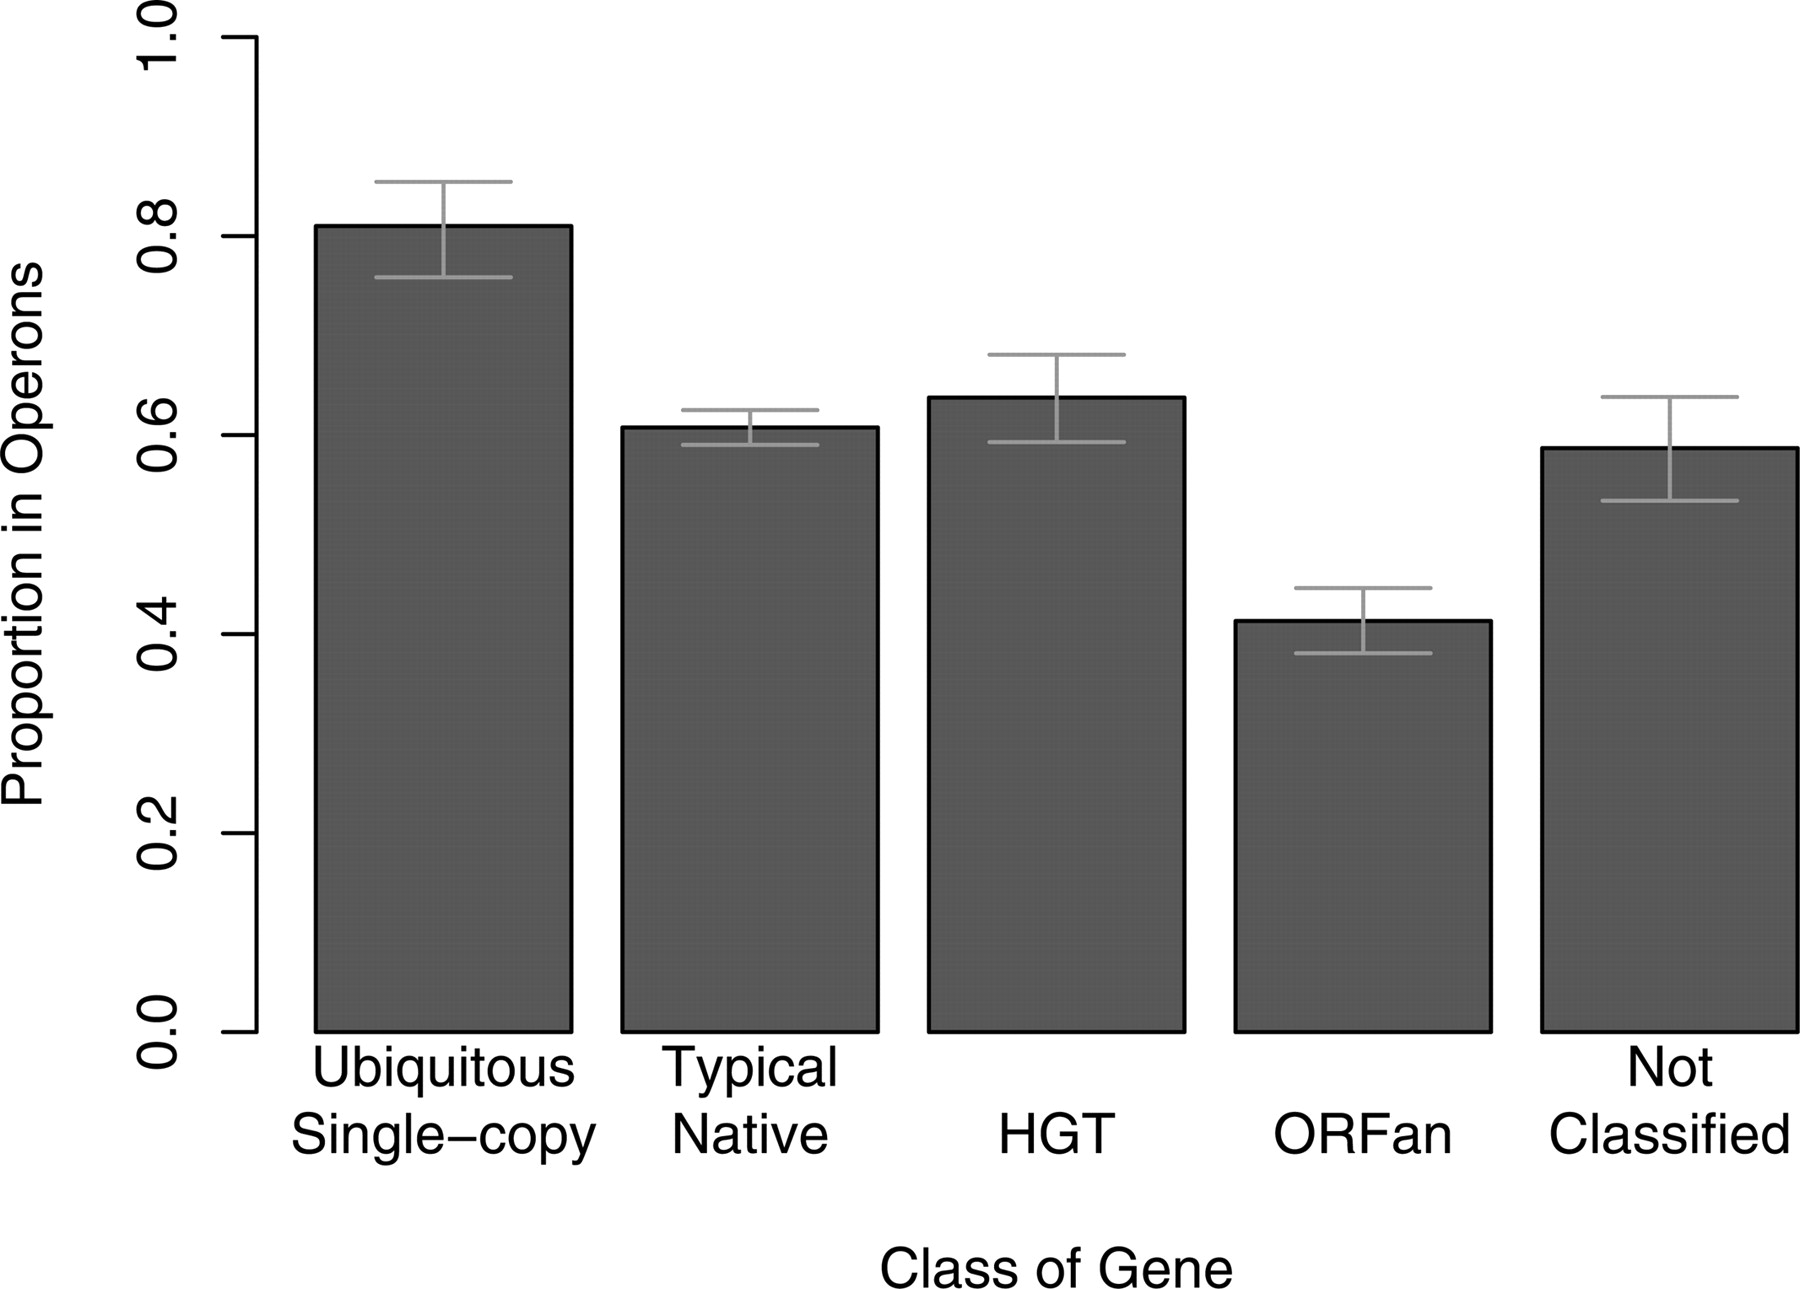
Figure 2.
HGT genes are not particularly likely to be in operons. For each class of gene, solid bars show the proportion that are in predicted operons. Error bars show 90% confidence intervals from the binomial test; if two error bars do not overlap, then the corresponding classes have significantly different probabilities of being in operons (P < 0.05).