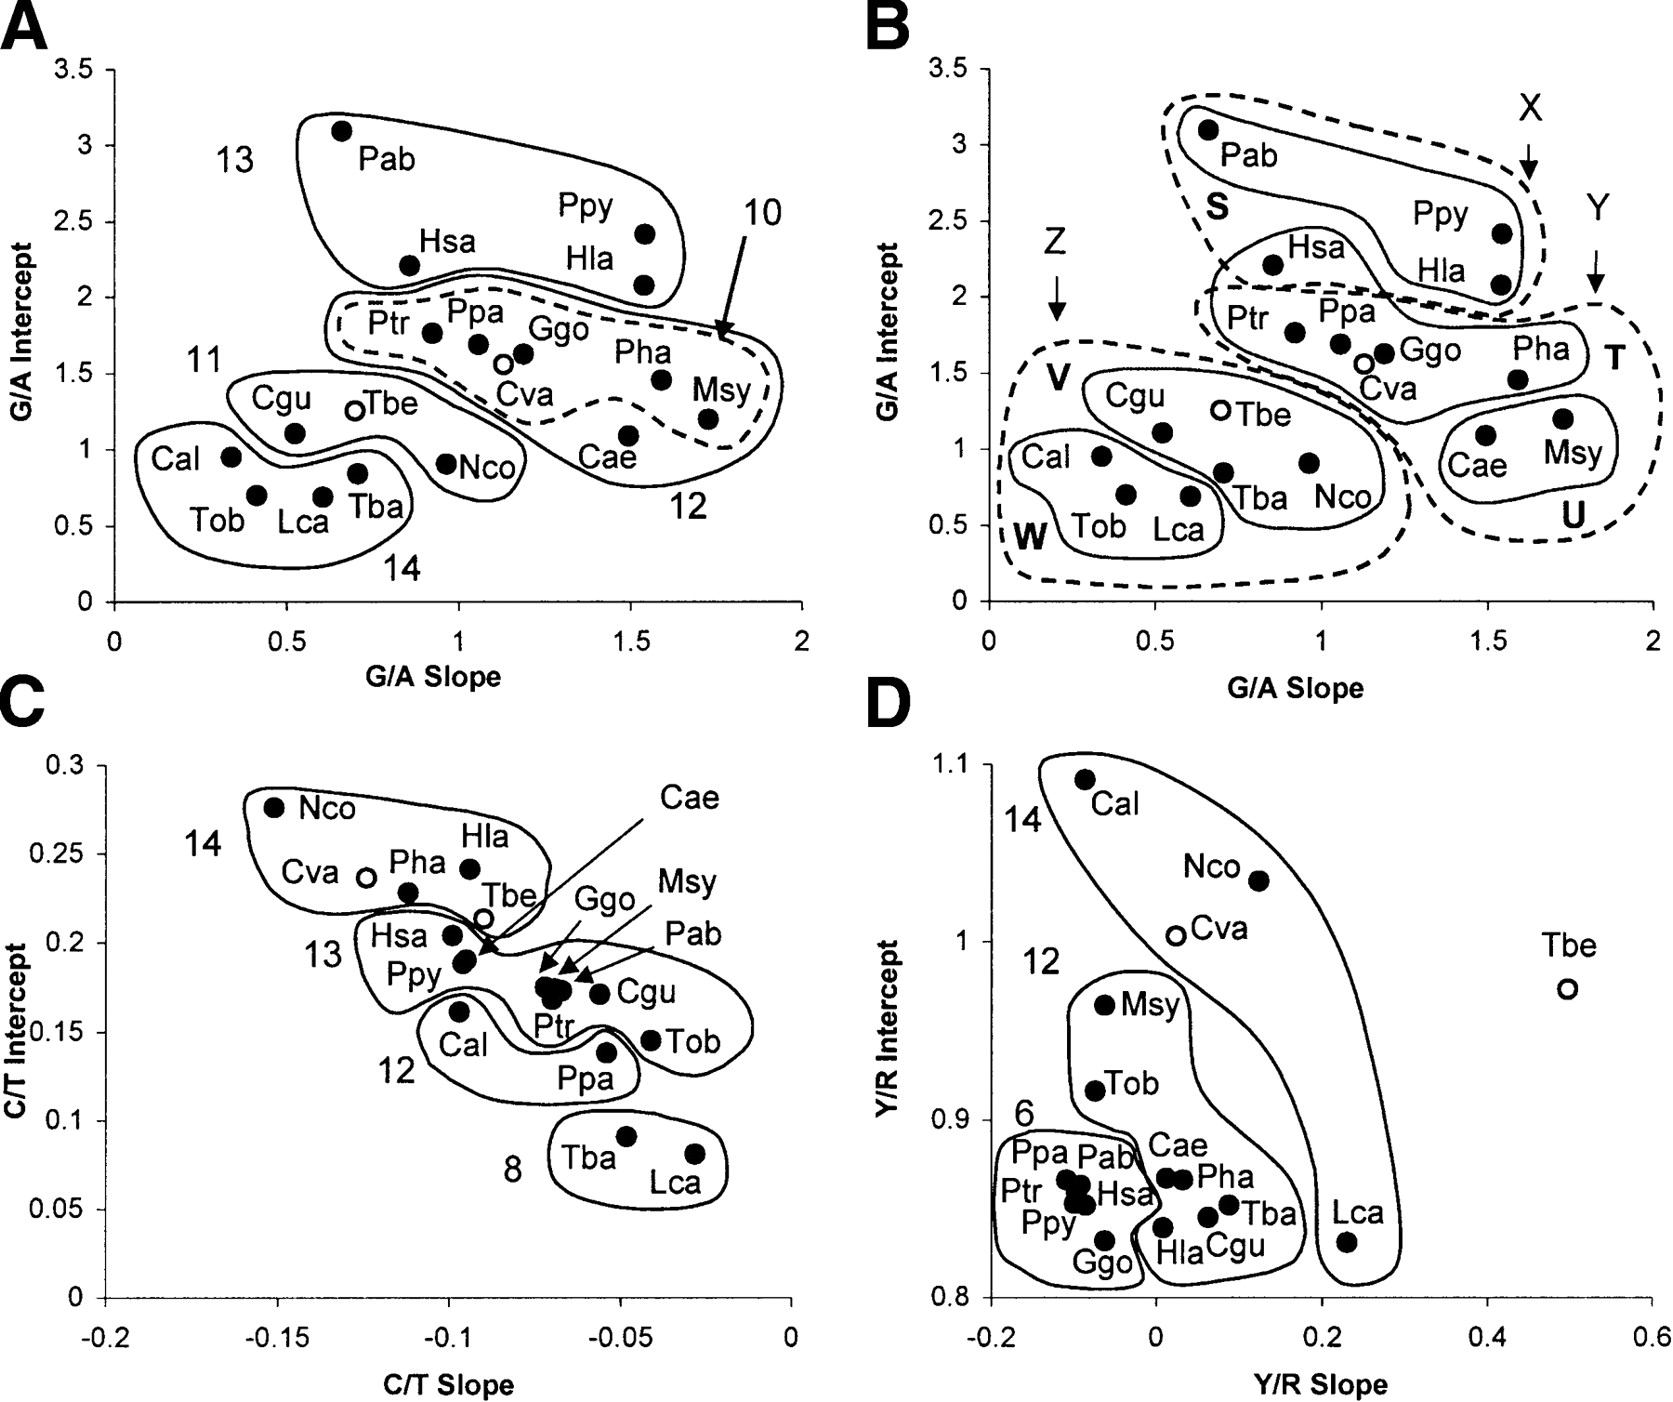
Figure 2.
Graph of MLE slopes versus MLE intercepts along with major clusters in ratio cluster analyses. We performed mixture (A) and hierarchical analyses (B) of G/A ratios, and hierarchical analyses of (C) C/T and (D) Y/R ratios. Groups are labeled by their order of clustering.