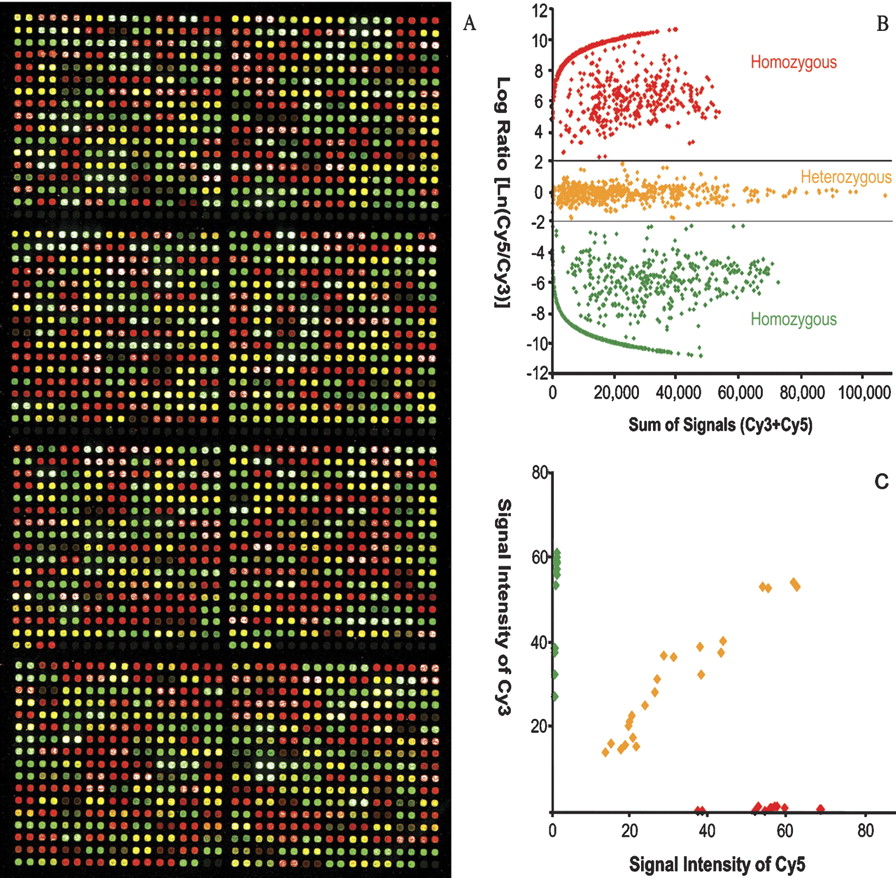
(A) A microarray image from genotyping one individual with Group II SNPs. Each probe was printed twice and shown as neighboring spots. Spots in red and green, homozygous; yellow, heterozygous; white, pink, and light green, spots with strong signal that have exceeded the linear range; and dark, low signal but not necessarily mean no signal or too low for genotype calls. (B) Scatter plot based on the color intensities from the microarray image shown in A. Two horizontal lines are the cutoffs (natural logarithms of the ratios [Cy3/Cy5] at 2 and -2) to divide the spots into three genotype groups. (C) A plot simply based on the two color intensities for the 24 samples (two spots for each sample) of an SNP. Values of the signal intensities indicated on the axes should be multiplied by 1000. Note that since different parameters are used, the color orientations are different in B and C.