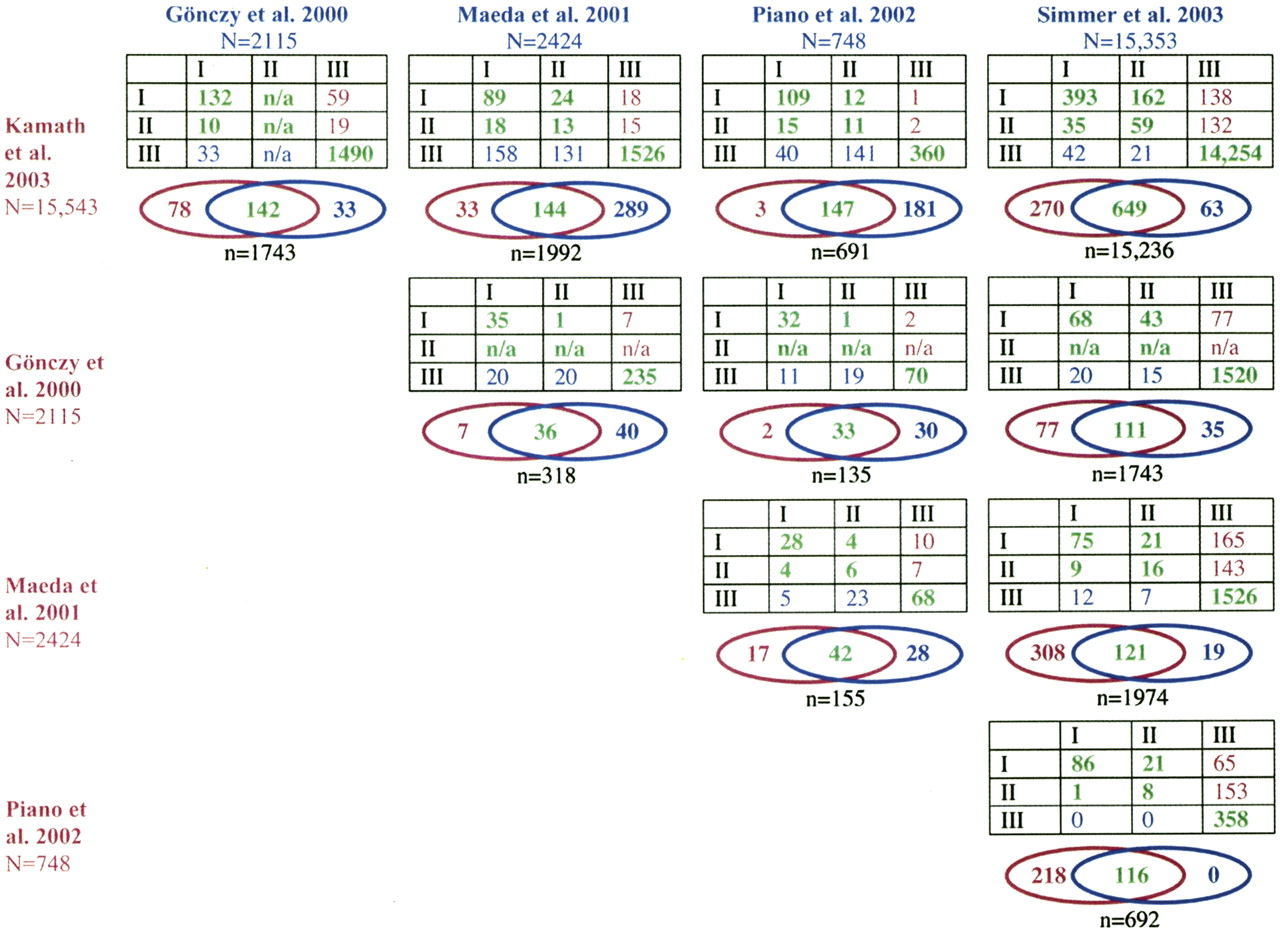
Comparison of results of large-scale RNAi studies. Each table shows the comparison of results between two RNAi studies, subdivided by gross penetrance levels. I, Class I penetrance (sterile and ≥80% embryonic lethal); II, Class II penetrance (6%-79% embryonic lethal); III, Class III (no sterility or embryonic lethality detected). Numbers in green indicate similar results by both studies; purple and blue numbers represent genes with sterility or lethality according to one study but not the other (blue: detected only by the study listed at the head of the panel column; purple: detected only by the study at the head of the panel row). For each study the total number of unique genes (excluding alternatively spliced forms) assayed (N) is indicated. Venn diagrams summarize the data in adjacent tables and show the total numbers of genes with sterile or embryonic lethal phenotypes detected by both (green) or only one study (blue, purple). The total number of overlapping genes analyzed by both studies (n) is indicated below each Venn diagram. Results from Simmer et al. (2003) that were reported as not reproducible were omitted from this analysis; all other wild-type results from this study were inferred (see Methods). No Class II results are indicated for Gönczy et al. (2000) (“n/a”, not applicable) because that study effectively scored only high-penetrance lethality. Figure 1 provides further information about how each of these studies was conducted.