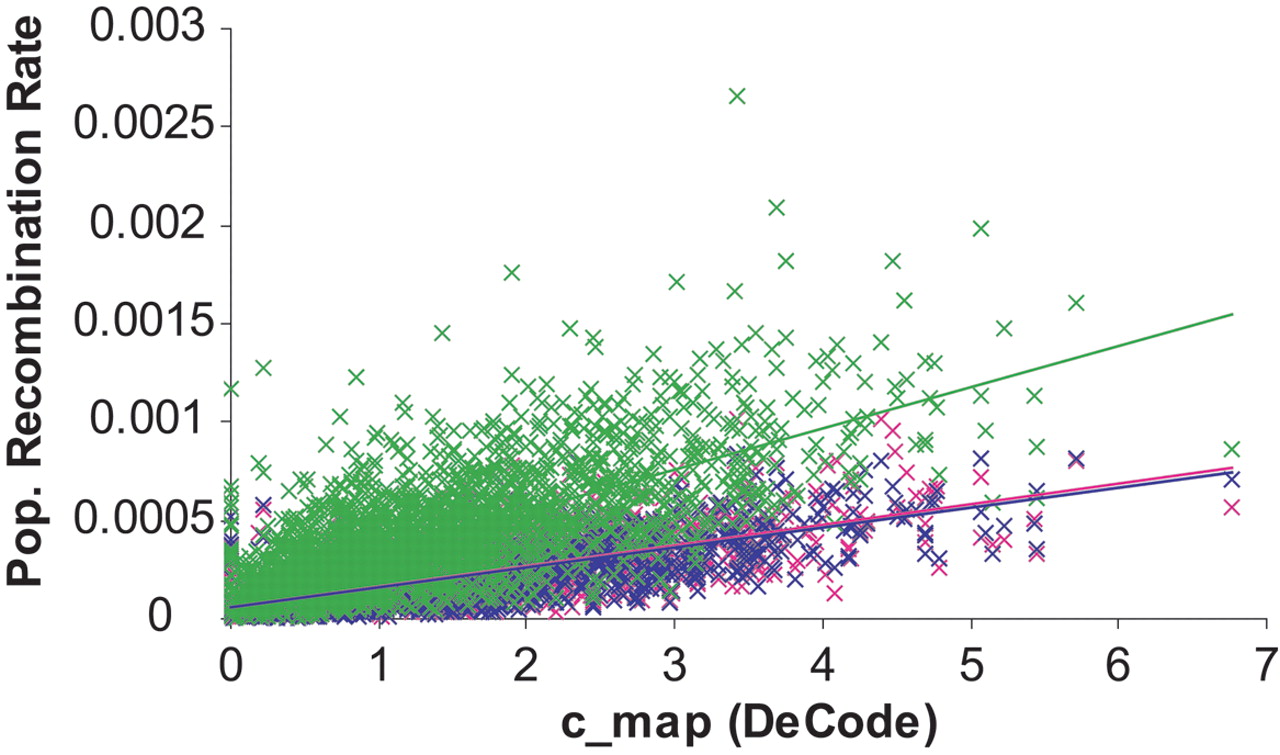
Figure 2.
Plot of the recombination rate estimates for 2609 windows of the human genome. Each point represents a 1-Mb window displayed according to the value of the DeCode recombination rate cmap (on the x-axis) and to the population recombination rate [TeX:] \batchmode \documentclass[fleqn,10pt,legalpaper]{article} \usepackage{amssymb} \usepackage{amsfonts} \usepackage{amsmath} \pagestyle{empty} \begin{document} \({\hat{{\rho}}}\) \end{document} calculated using 23 unrelated individuals from the Perlegen data set (on the y-axis). The estimates for the Han Chinese population are in pink, for the African-Americans in green, and for the European-Americans in blue. The straight lines are the regression lines obtained for each population.