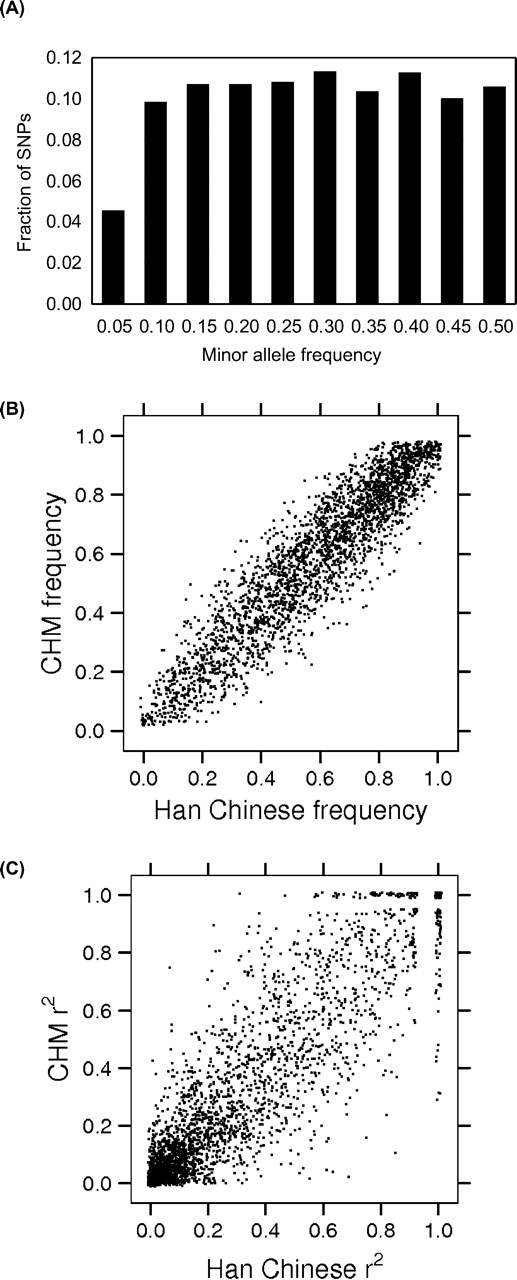
Figure 2.
Allele frequencies and linkage disequilibrium of SNPs used in this study. (A) Fractions of SNPs in bins of minor allele frequencies among CHMs are shown. Comparisons of allele frequencies (B) and r2 values (C) between CHM and Han Chinese are shown. One percent of the genotyped SNPs are displayed (i.e., ∼2800) to keep the number of points manageable in B and C.