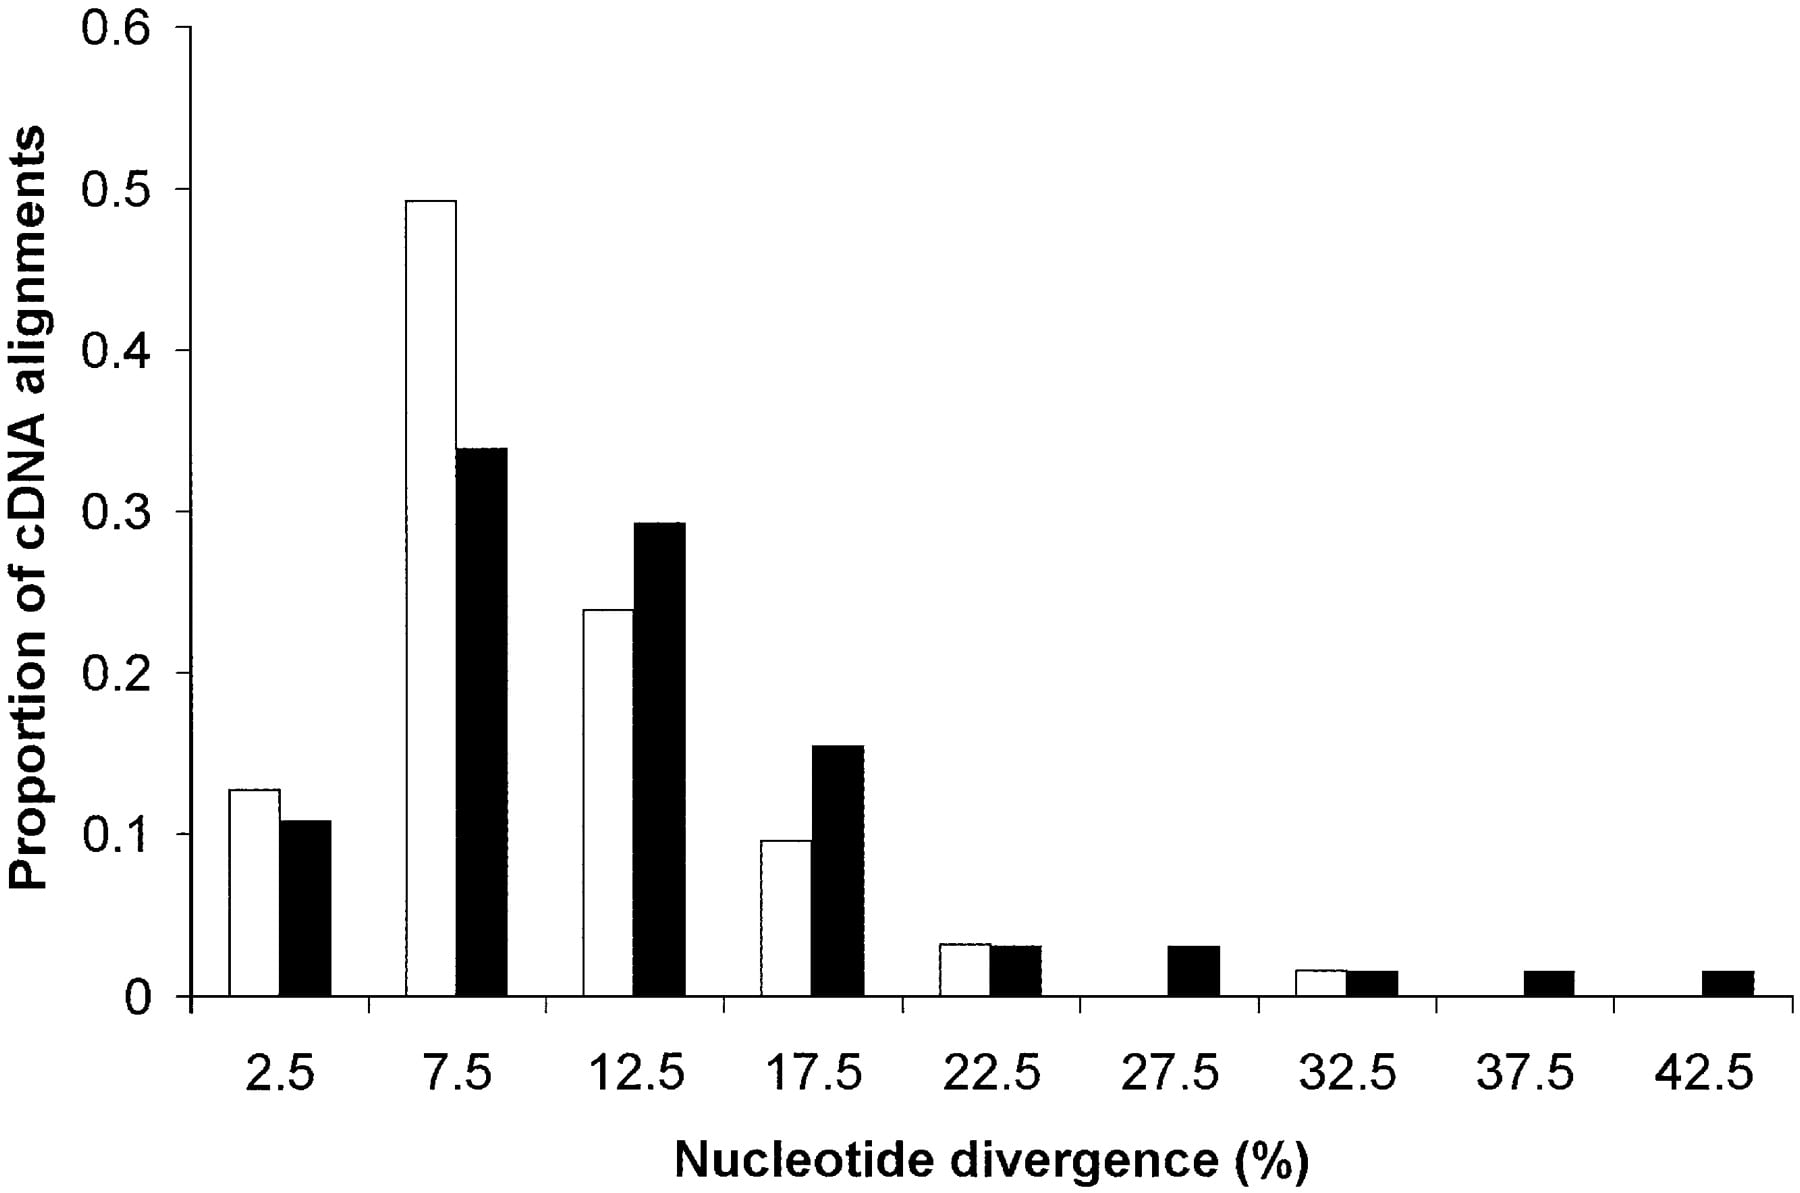
Figure 2.
Histogram showing levels of chicken-turkey divergence at synonymous sites in 59 macrochromosomal (white bars) compared with 65 microchromosomal cDNA alignments (black bars). The X-axis shows the midpoint of each category, and the height of bars represents the relative proportion in each category.