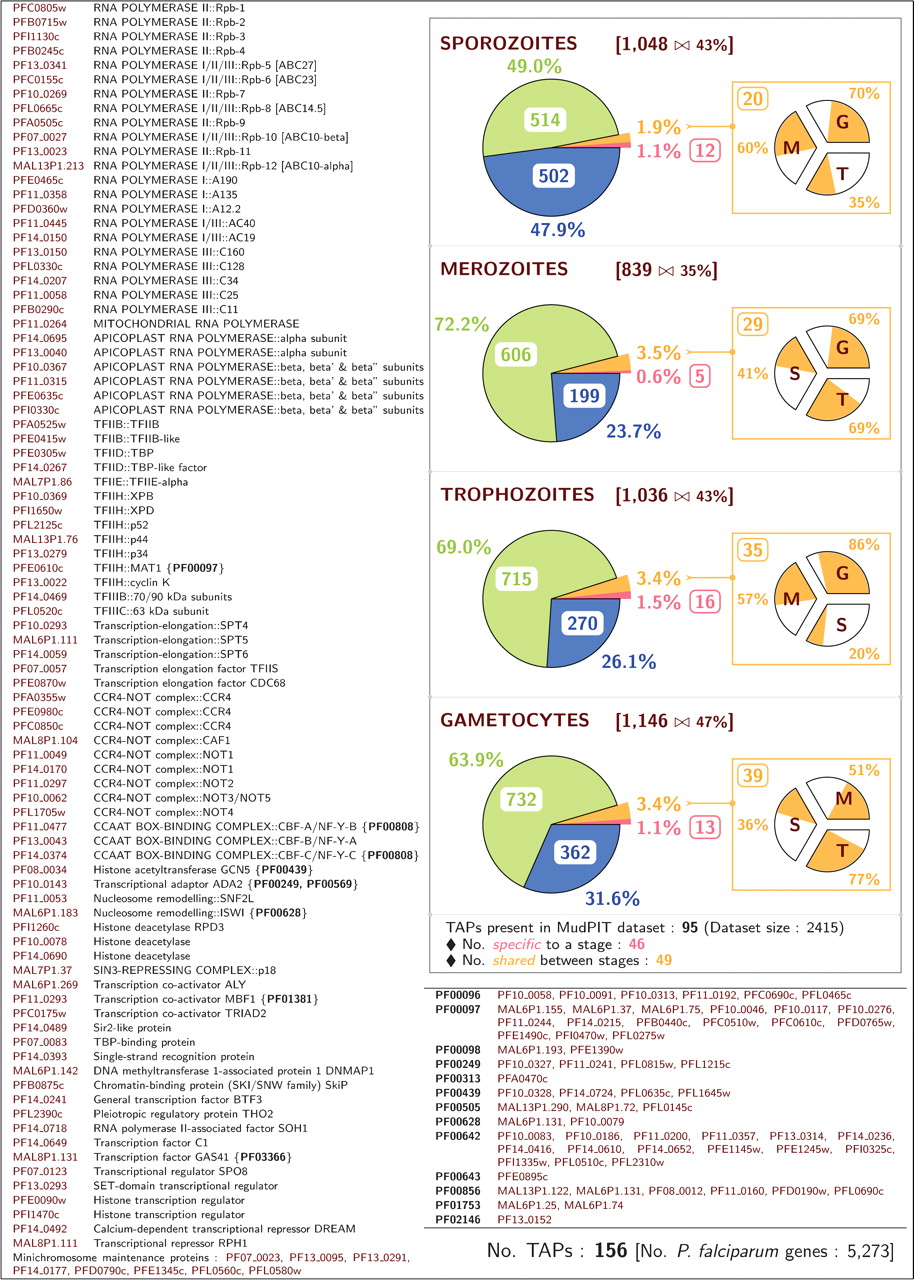
Malarial TAP homologs and their expression patterns. The left column lists the 95 P. falciparum sequences identified by the TRIBE-MCL clustering and annotation procedure. Sequence identifiers are shown in brown. Next to each sequence identifier is shown a functional annotation of the protein. If the annotation contains a double colon (::), then the complex of which the sequence is a component is listed to the left of the double colon. Annotations containing {PFnnnnn} indicate the Pfam accession number(s) of the HMM(s) that match(es) the sequence. (Bottom) The right column (between the two parallel lines) shows the Pfam accession number of a HMM and the identifiers of the malarial sequences that match the HMM. (Top) The right-hand column represents as pie charts, the proportion of the malarial TAPs expressed in the sporozoite (S), merozoite (M), trophozoite (T), and gametocyte (G) stages. The expression profiles were obtained from the multidimensional protein identification technology (MudPIT) dataset. The blue and green sectors of the piecharts indicate the number of proteins not associated with transcription (also shown as percentage of total number expressed in the stage), whose expression is either specific to or unrestricted to a stage, respectively. The number of TAPs that are only expressed in the stage is indicated in the red box, and the number in the rounded orange box indicates the number that are also expressed in other stages. The percentage of these TAPs, of the total number of proteins expressed in the stage, is also indicated. In the square orange box, each of the three sectors of the pie chart shows the percentage of the nonstage-specific TAPs expressed in the other three stages.