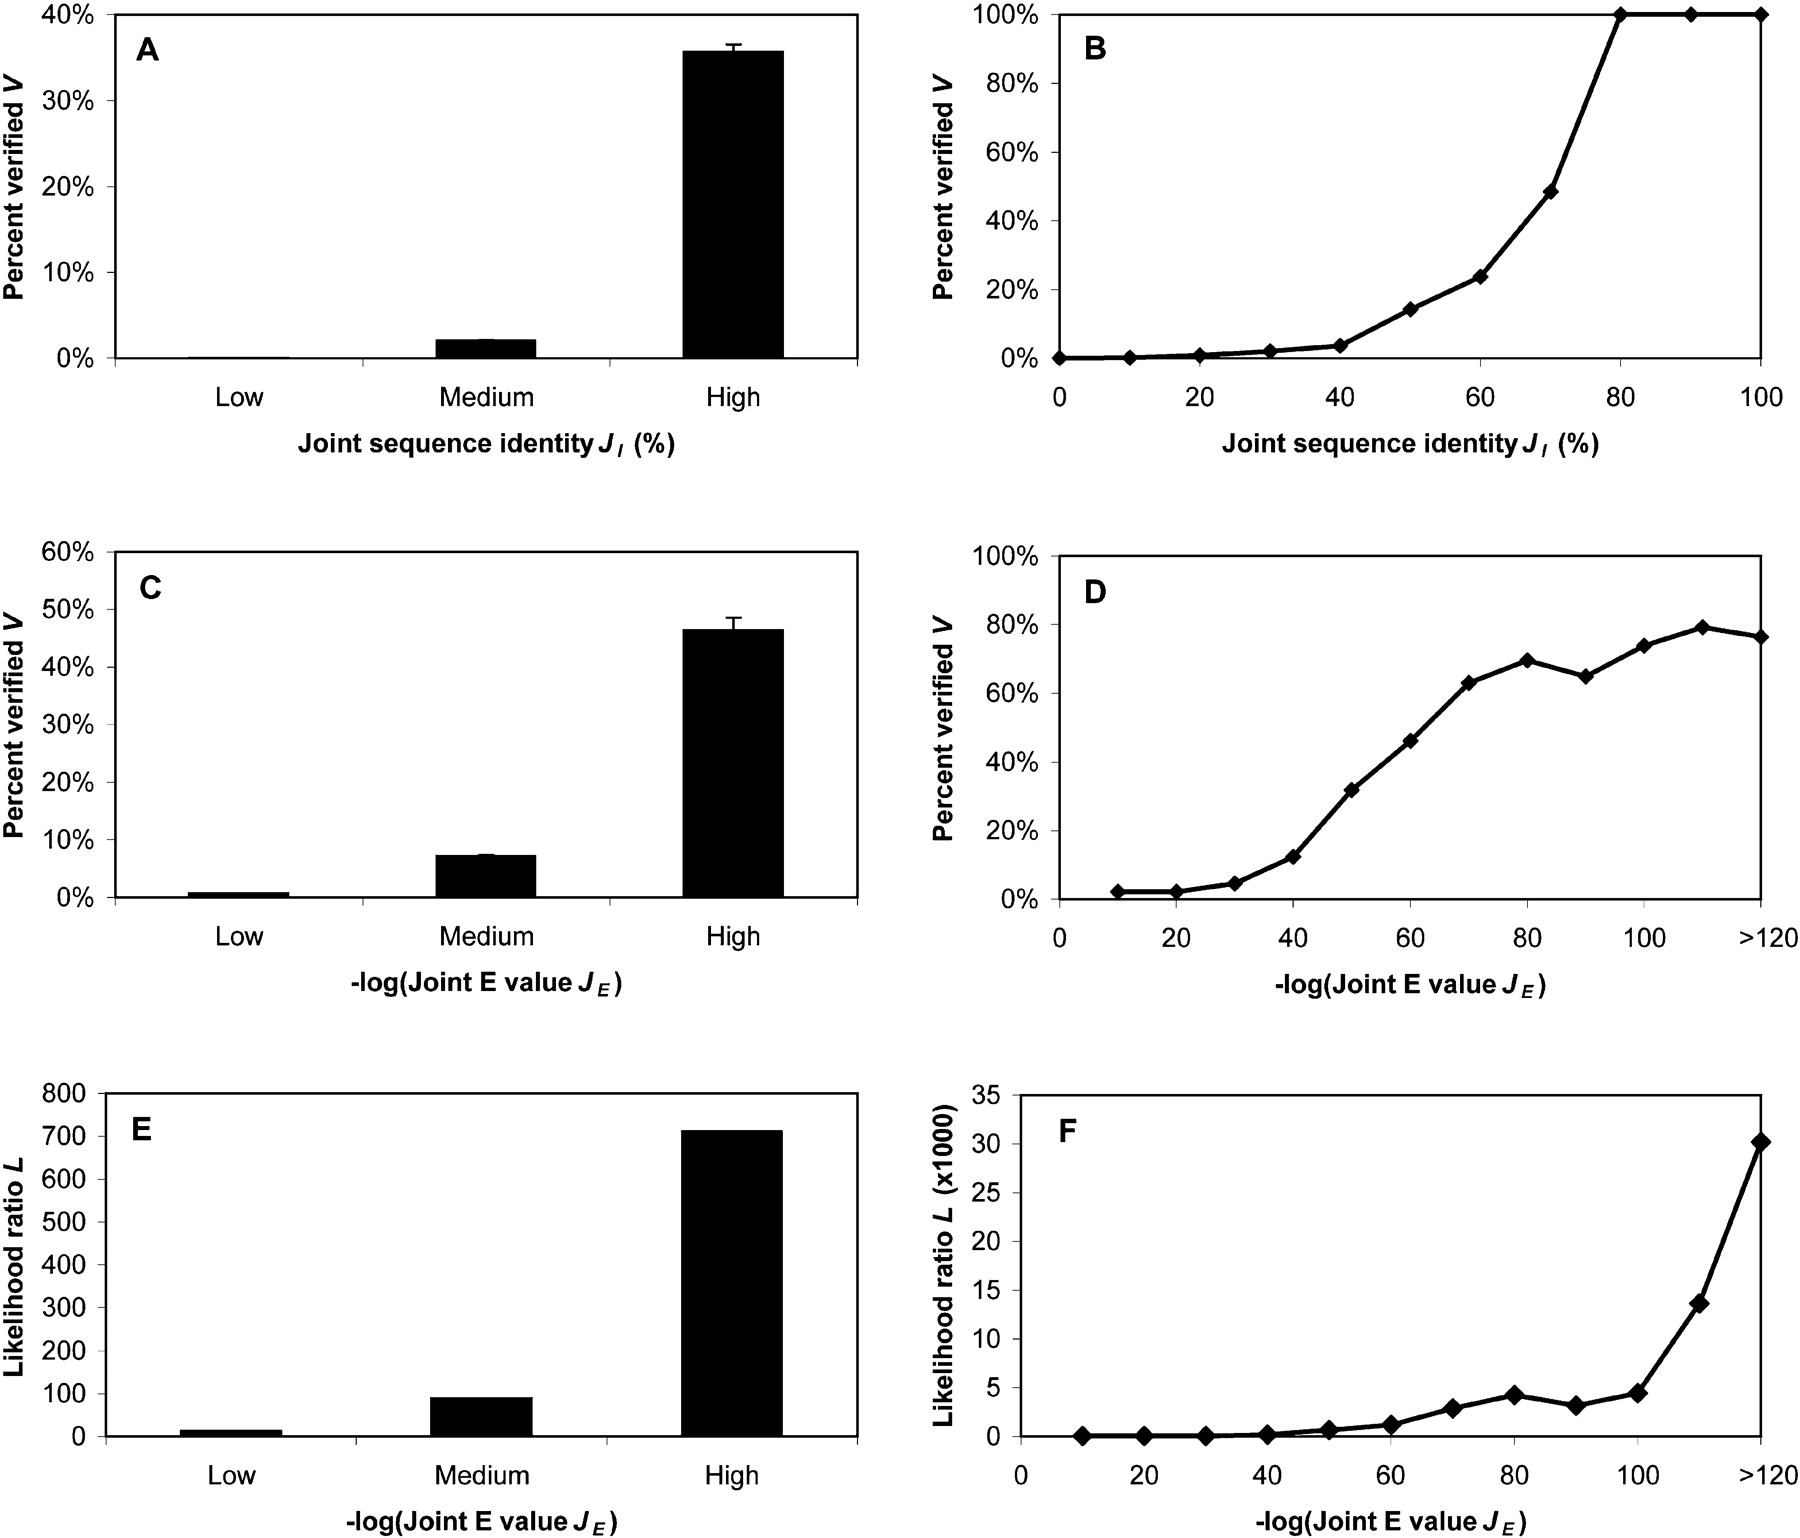
Figure 2
Conservation of protein–protein interactions between homologous protein pairs. (A,B) Relationships between V and JI. (C,D) Relationships between V and JE.(E,F) Relationships between L and JE. (A,C,E) Calculated based on the results from worm-yeast mapping. (B,D,F) The weighted average obtained when the interactions in all four organisms (i.e., S. cerevisiae, C. elegans, D. melanogaster, and H. pylori) were mapped onto yeast. (A) Low: JI ≤ 10%; Medium: 20% ≤ JI ≤ 30%; High: JI ≥ 40%. (C,D) Low: 10–40 ≤ JE ≤ 10–10; Medium: 10–100 ≤ JE ≤ 10–50; High: JE ≤ 10–110. Error bars represent 95% CI calculated by a resampling algorithm (see Supplemental material).