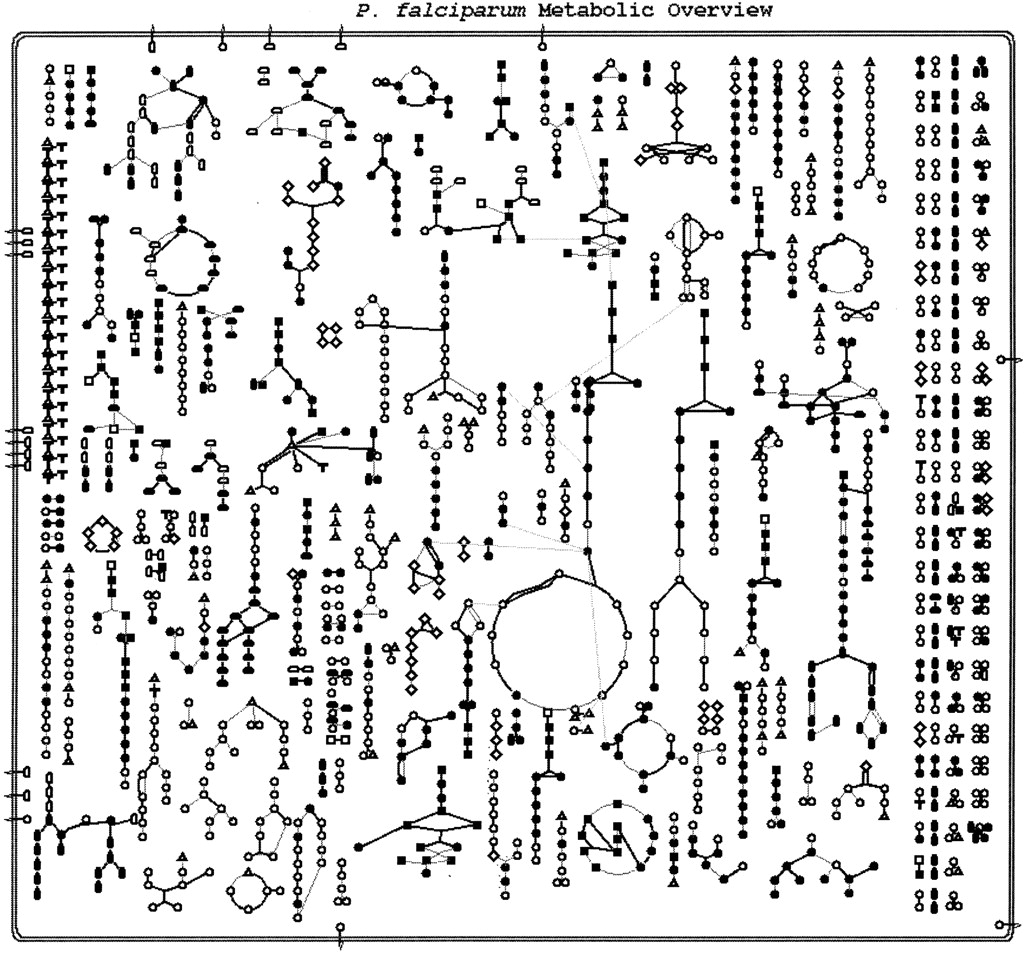
Figure 2
Overview of the metabolic map for P. falciparum. Each node represents a metabolite, with the type of metabolite indicated by the shape of the node as indicated by the legend. The lines connecting the metabolites represent reactions. Bold lines correspond to reactions with an identified enzyme; gray lines correspond to reactions without an identified enzyme.