Figure 2
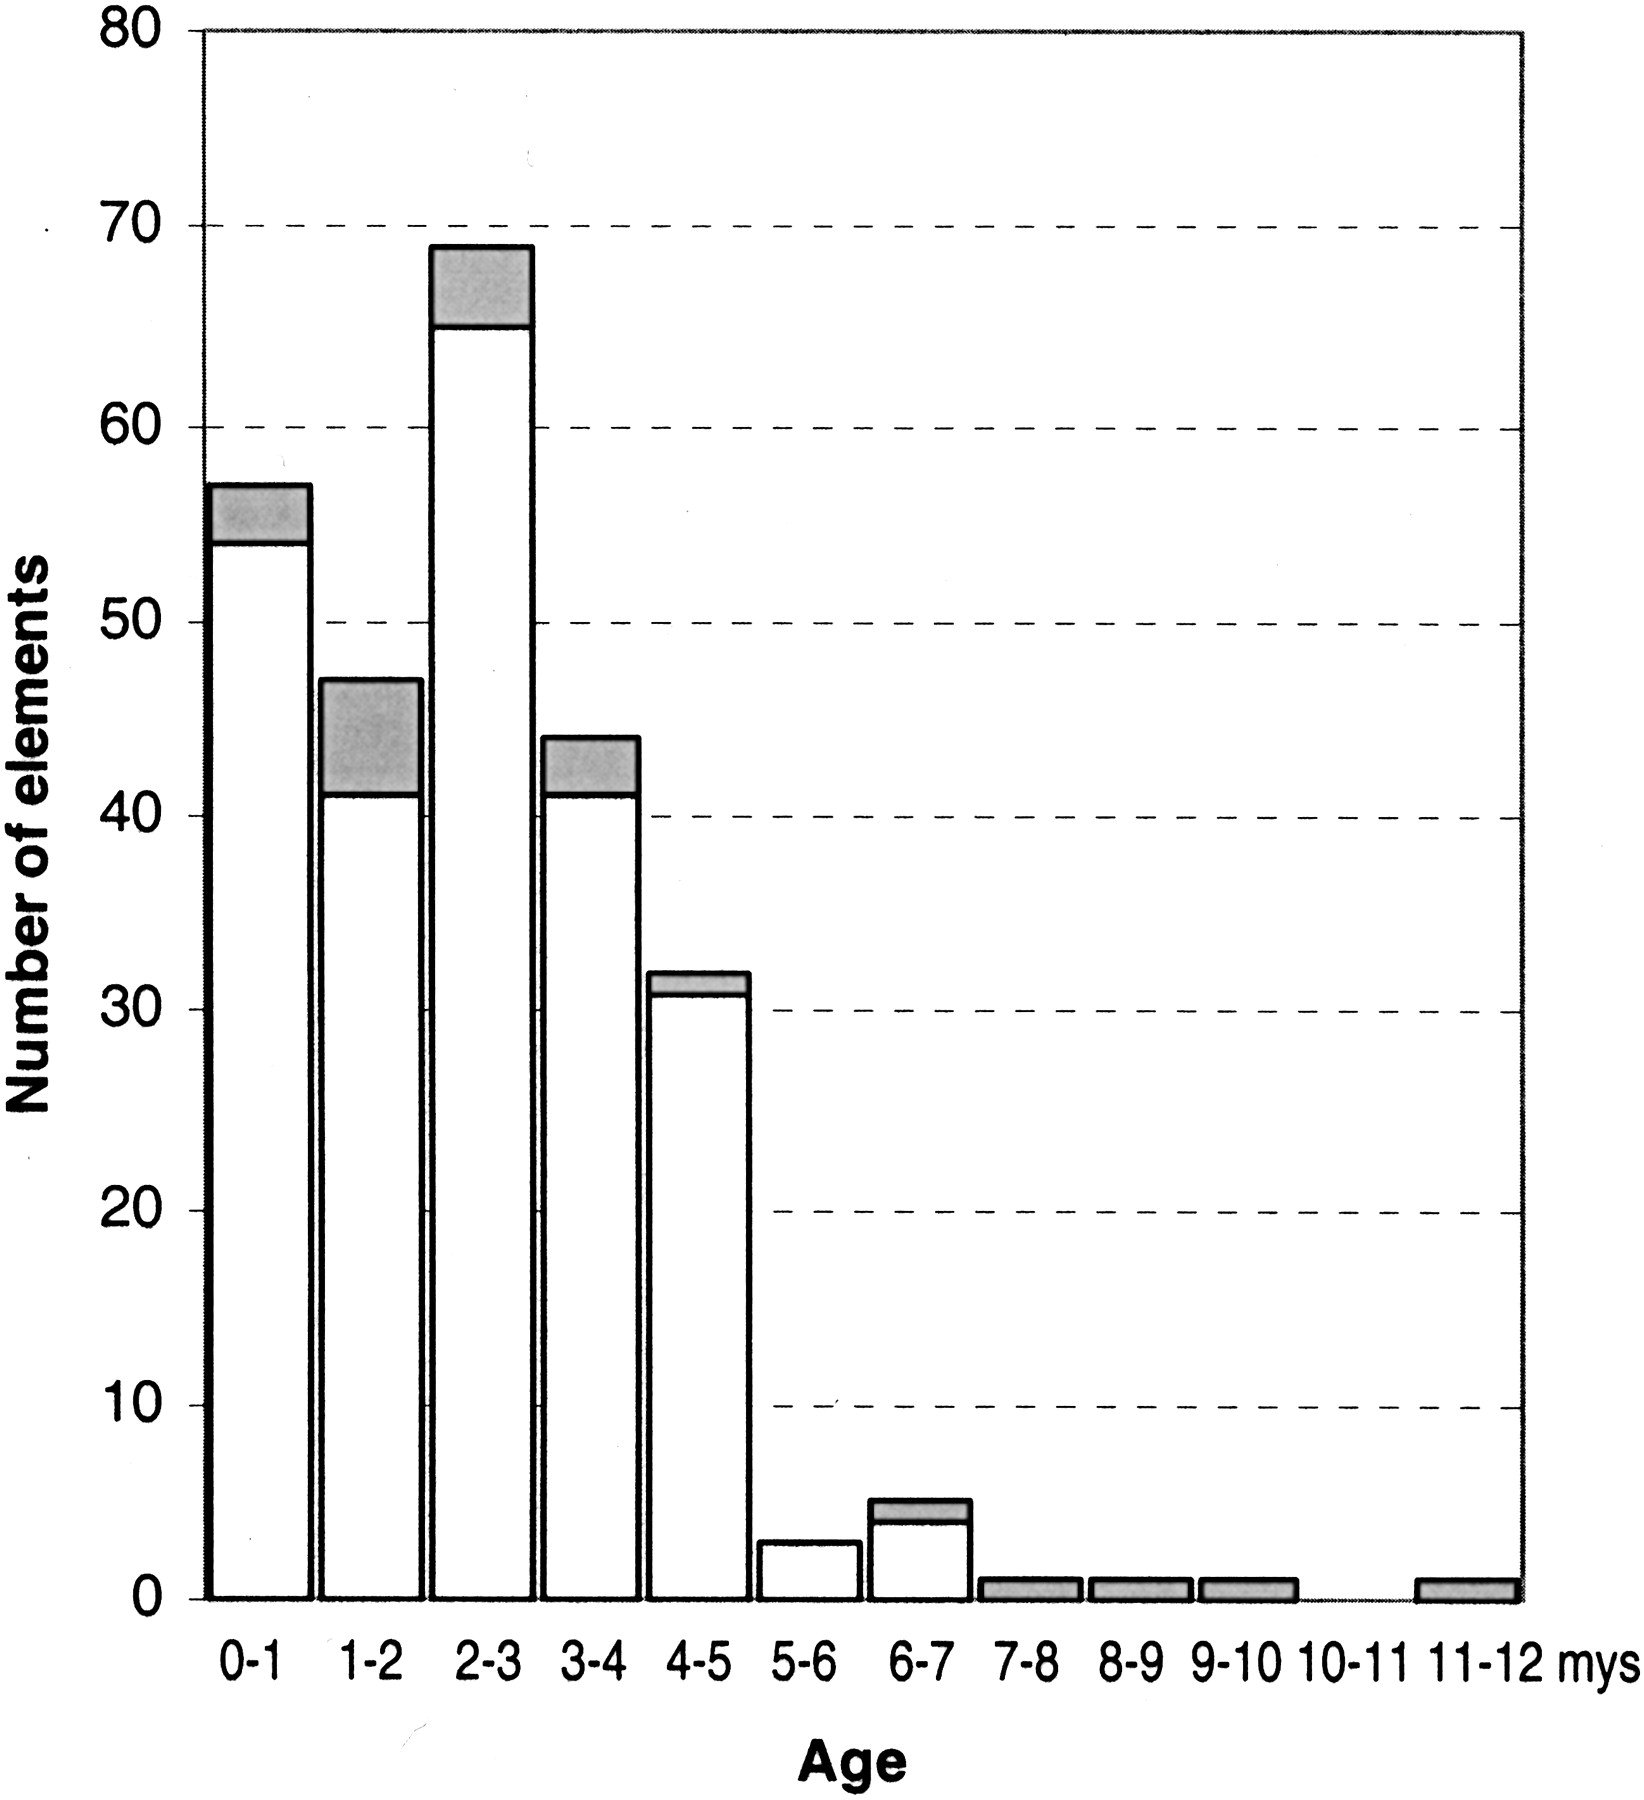
Distribution of ages of LTR retrotransposons in rice. Open bars show intact elements. Gray bars show elements with partially deleted LTRs. (mys) Million years.
Distribution of ages of LTR retrotransposons in rice. Open bars show intact elements. Gray bars show elements with partially deleted LTRs. (mys) Million years.