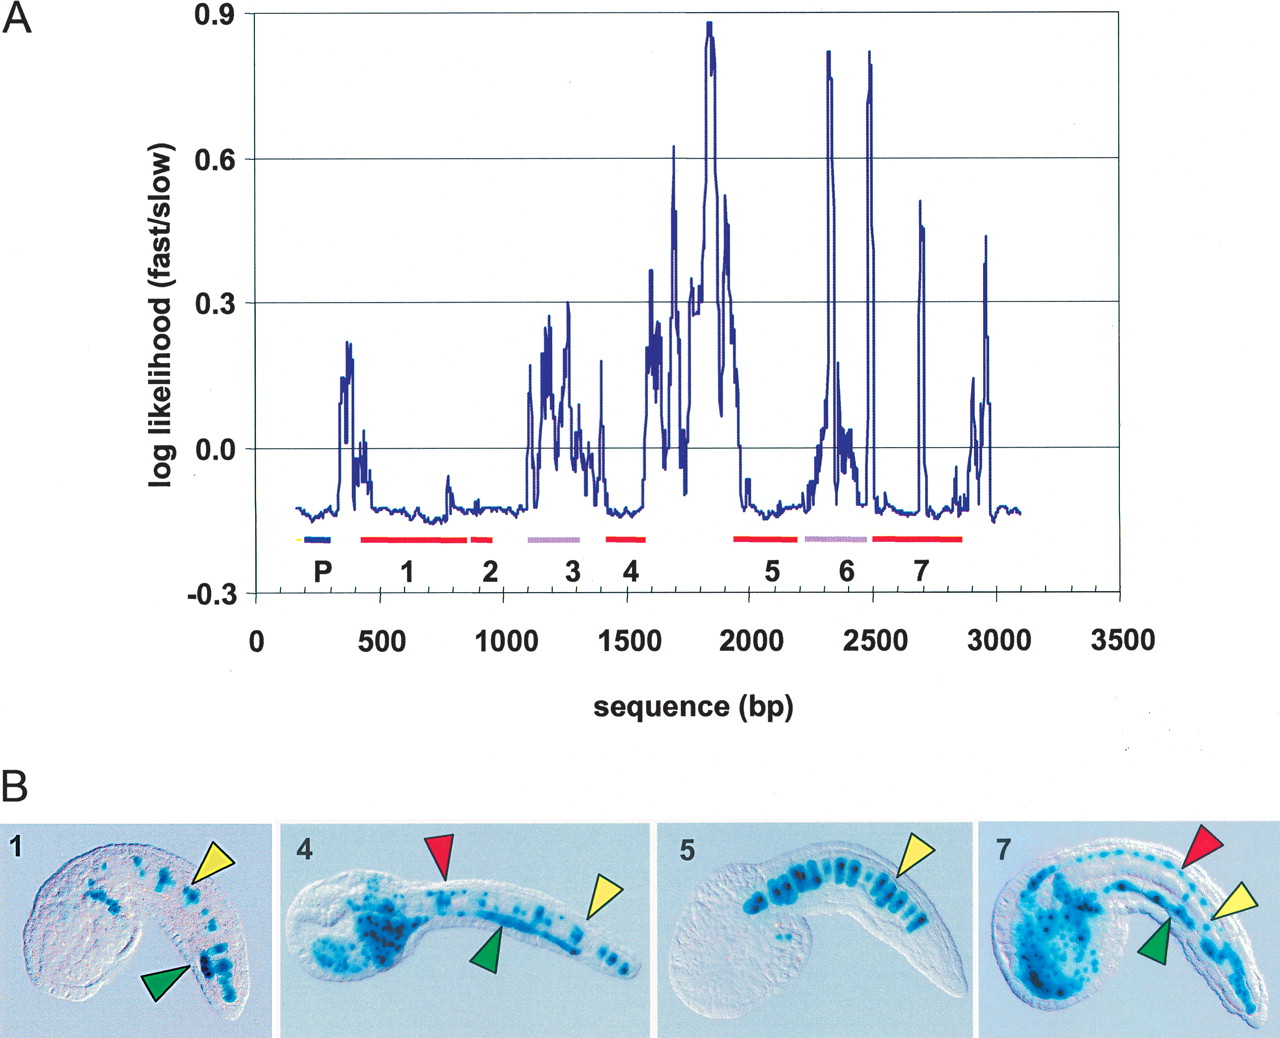
(A) Mutation rate analysis of the genomic interval containing the 5′ region of the forkhead gene. The x-axis represents the position in the multiple alignment consensus sequence, the y-axis the log likelihood ratio for a fast- over a slow-mutation regime at that position. The plot is smoothed using a 20%-trimmed mean over the 24-base window centered at each aligned site. A lower ratio indicates a low mutation rate. The sequence of 33 individuals (total tree length = 0.28) was used to generate this plot. The blue bar labeled “P” indicates the position of the forkhead promoter; the red and purple bars indicate the positions of low- and high-mutation rate intervals, respectively, that were functionally analyzed in this study. (B) Transgenic analysis of intervals identified by mutation rate analysis of the 5′ region of the forkhead gene. C. intestinalis larvae were electroporated with a reporter construct containing the genomic fragments 1, 2, 4, 5, and 7, respectively and the expression was visualized by histochemical staining with X-gal. Constructs for region 2 never yielded LacZ expression, and the position marked on the plot corresponds to a segment previously analyzed (Di Gregorio et al. 2001). Red arrows indicate expression in the neural tube, yellow arrows that in the notochord, and green arrows in the endoderm. Constructs for region 2 failed to yield tissue-specific expression.