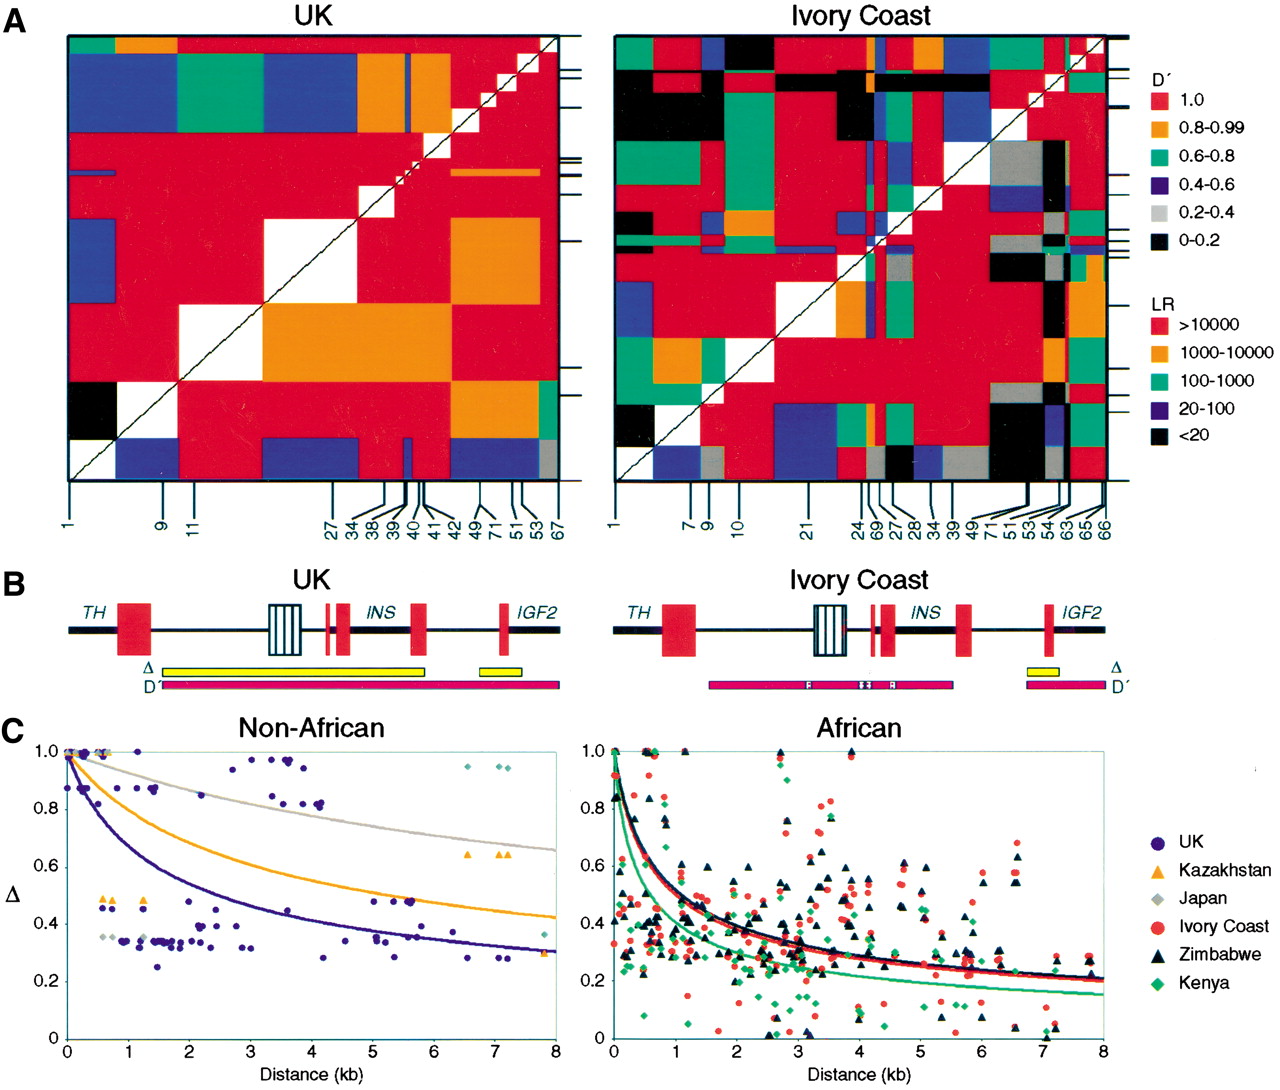
Linkage disequilibrium (LD) across 7.8 kb of the insulin gene region. (A) LD patterns in U.K. and Ivory Coast populations. D′ measures of complete LD between each pair of markers (bottom right) and the likelihood ratio vs. free association (top left) are shown for the largest non-African population (102 individuals from the U.K.) and the largest African population (78 from the Ivory Coast) included in this study. LD measures were estimated from diploid genotype data, after excluding all markers with minor allele frequencies <0.15. Regions of high LD appear as red blocks. Each colored block is centered on the two SNPs being compared and extends halfway to the adjacent marker. Positions of SNPs are shown below and to the right of each plot, with SNP identities indicated below. (B) Schematic of the insulin gene region, as in Fig. 1. Regions of high absolute association (Δ) are indicated in yellow, with regions of high complete association (D′) in pink. Checked pink boxes show four African SNPs within a block of complete LD which display evidence of obligate recombination. (C) Decay of absolute disequilibrium (Δ) with distance. Δ was estimated for each pair of markers with minor allele frequency ≥0.15 and plotted against physical distance between markers for each of the six populations. Lines show the least-squares best-fit curves calculated for the theoretical relationship [TeX:] \batchmode \documentclass[fleqn,10pt,legalpaper]{article} \usepackage{amssymb} \usepackage{amsfonts} \usepackage{amsmath} \pagestyle{empty} \begin{document} \(|{\Delta}|=\sqrt{1{/}(1+4N_{e}rd)}\) \end{document} where Ne is the effective population size, r is the recombination frequency per Mb, and d is the intermarker distance in Mb (Sved 1971).