Figure 2
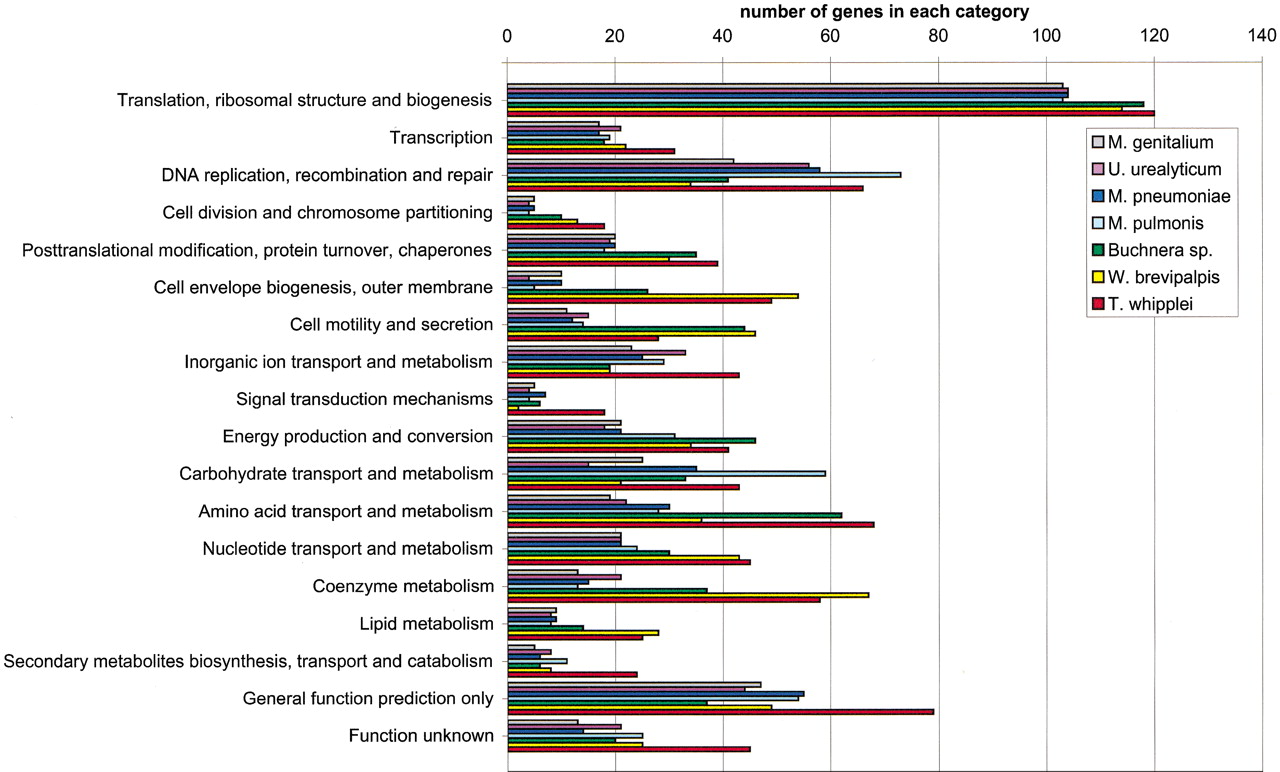
Comparative analysis of the number of genes present in each functional category as defined by the COG database. For the sake of comparing bacterial genomes of largely different sizes, a percentage graph is provided in Suppl. Fig. S2.
Comparative analysis of the number of genes present in each functional category as defined by the COG database. For the sake of comparing bacterial genomes of largely different sizes, a percentage graph is provided in Suppl. Fig. S2.