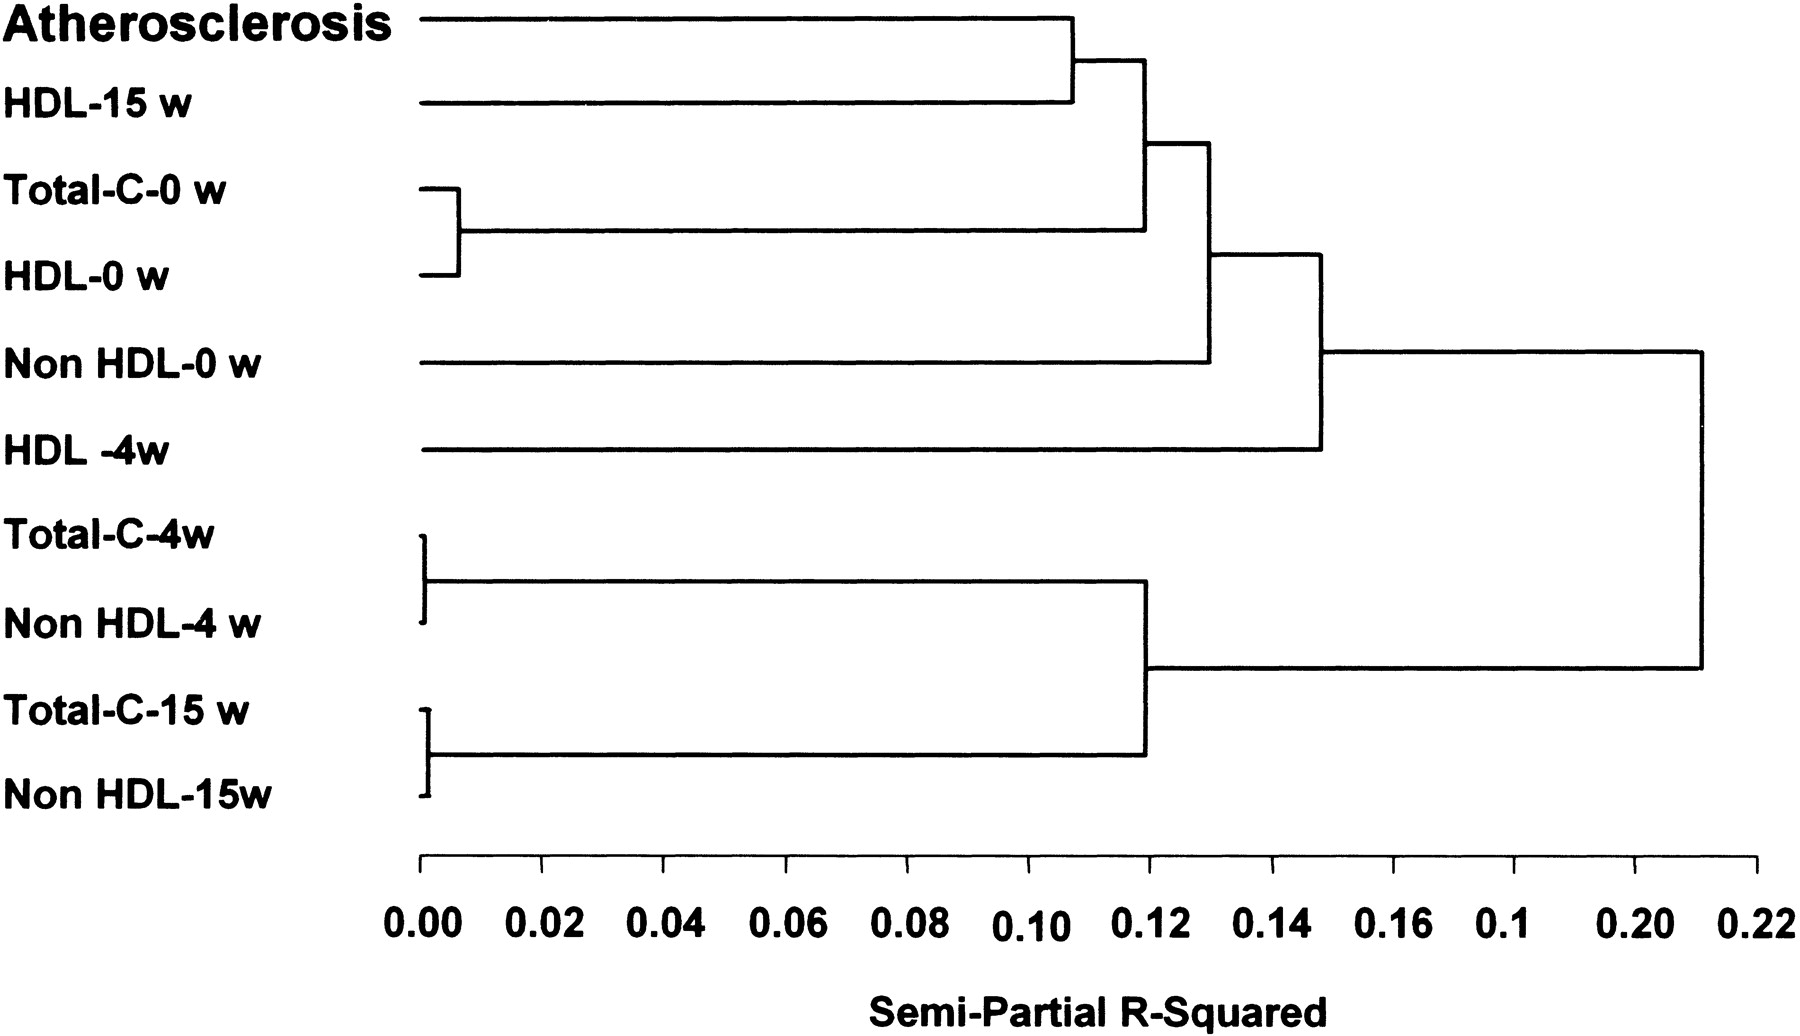
Figure 2
Hierachical clustering analysis for atherosclerosis and plasma lipid levels in the 104 (B6 × NZB)F1 × B6 backcross progeny. Total and HDL cholesterol were measured in mice fed chow (0 w), mice fed a high-fat diet for 4 weeks (4 w), and mice fed a high-fat diet for 15 weeks (15 w). Non-HDL was calculated by subtracting HDL from total cholesterol. Atherosclerotic lesions were determined by averaging the lesion sizes of five aortic root cross sections from each mouse. The length along the X-axis represents the distance between two clusters, expressed in semipartial R2 distance. The more similar the traits are, the closer they will appear in the cluster tree.