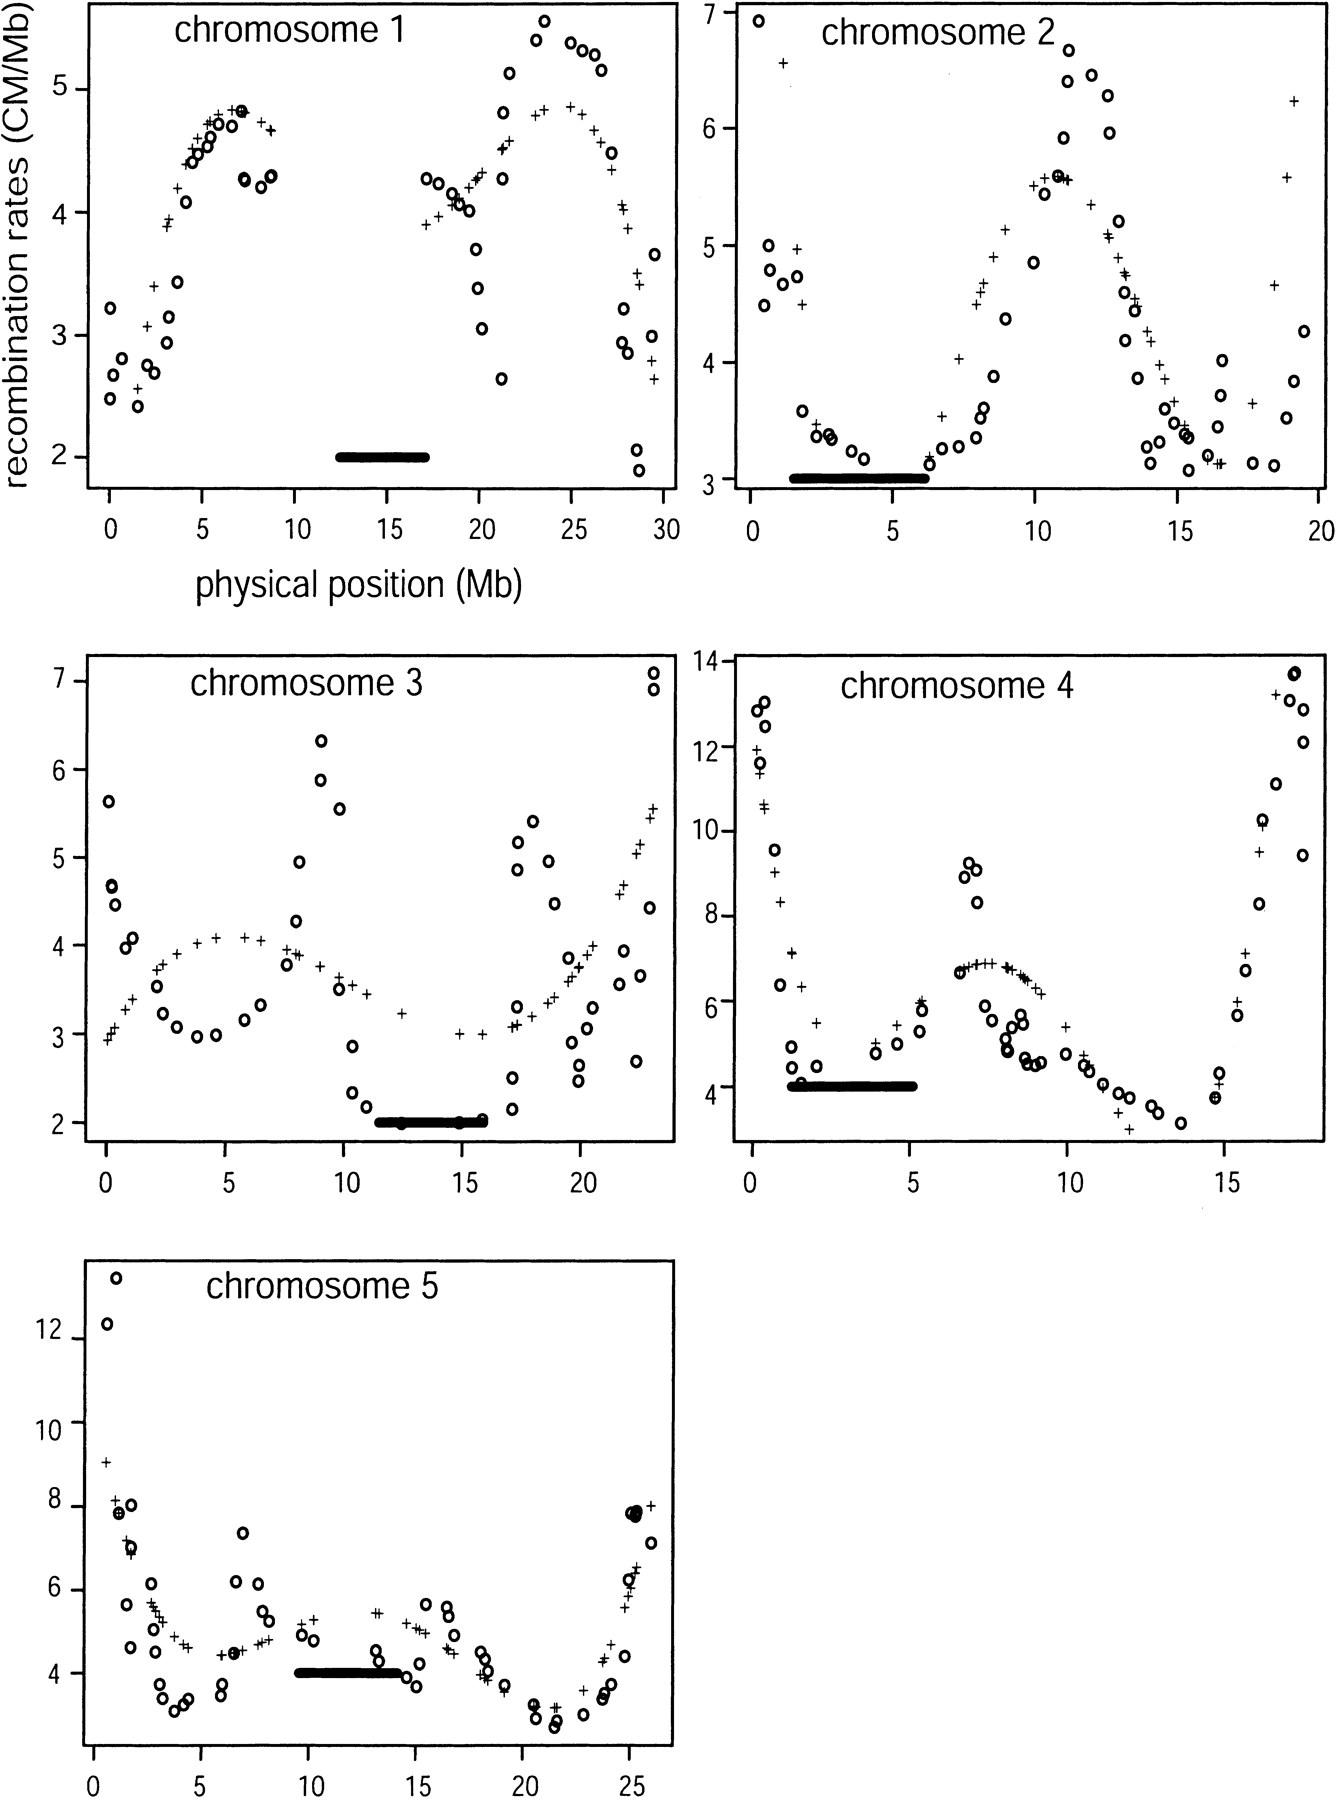
Figure 2
Recombination rates estimated by the global and local approaches. + represents global rate estimates by a fifth-order polynomial; circles represent local estimates. The bar represents the centromeric region and estimate recombination rates in this region.