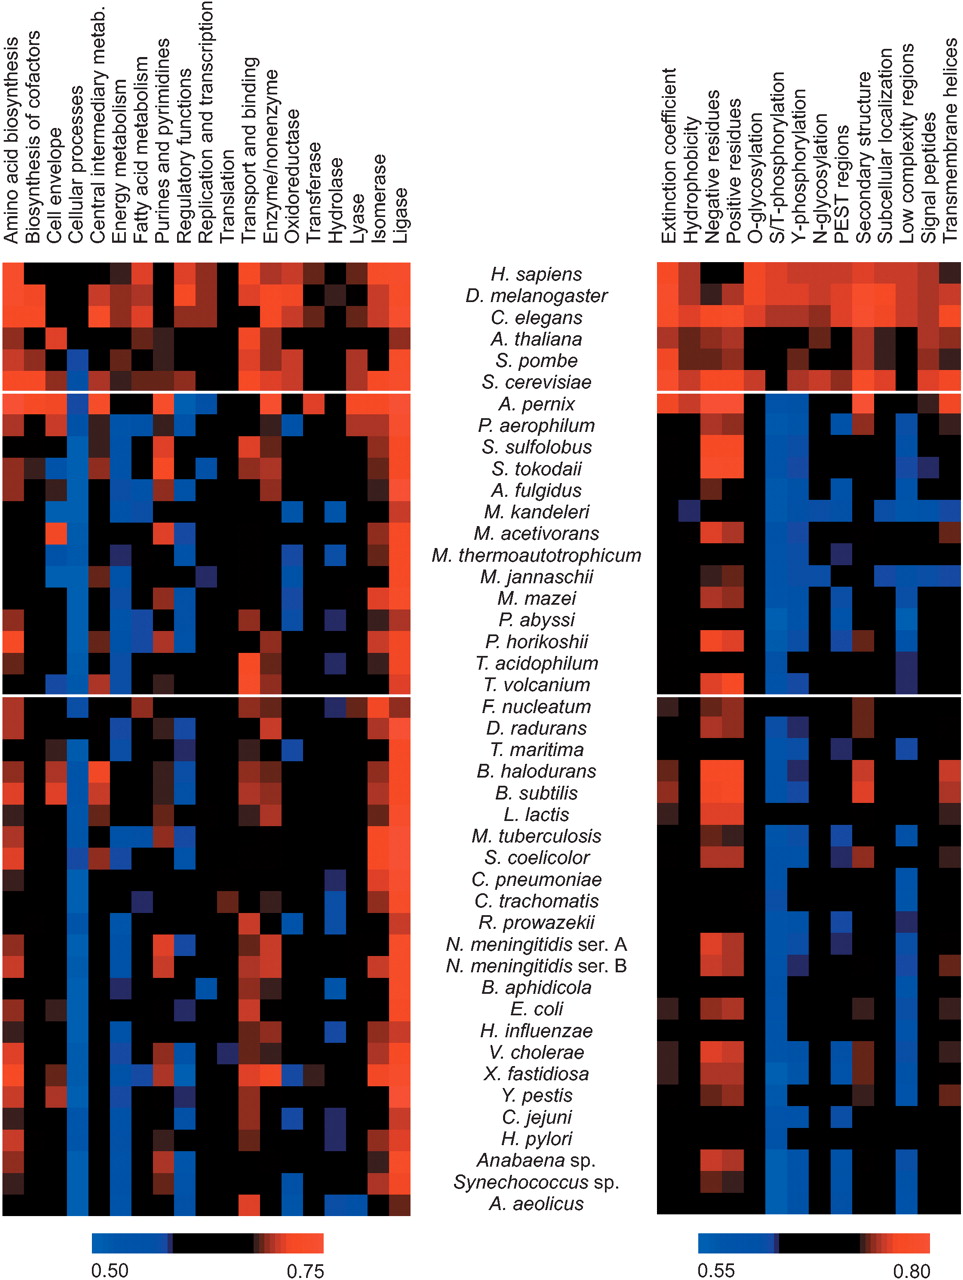
Figure 2
ProtFun performance for functional classes and performance contributions from input features. For 44 organisms the area under the receiver output characteristic (ROC) curve has been plotted for all cellular role categories and enzyme classes (left panel). These performances were mapped into input features based on the feature usage matrix (see Fig. 1 in Jensen et al. 2002).