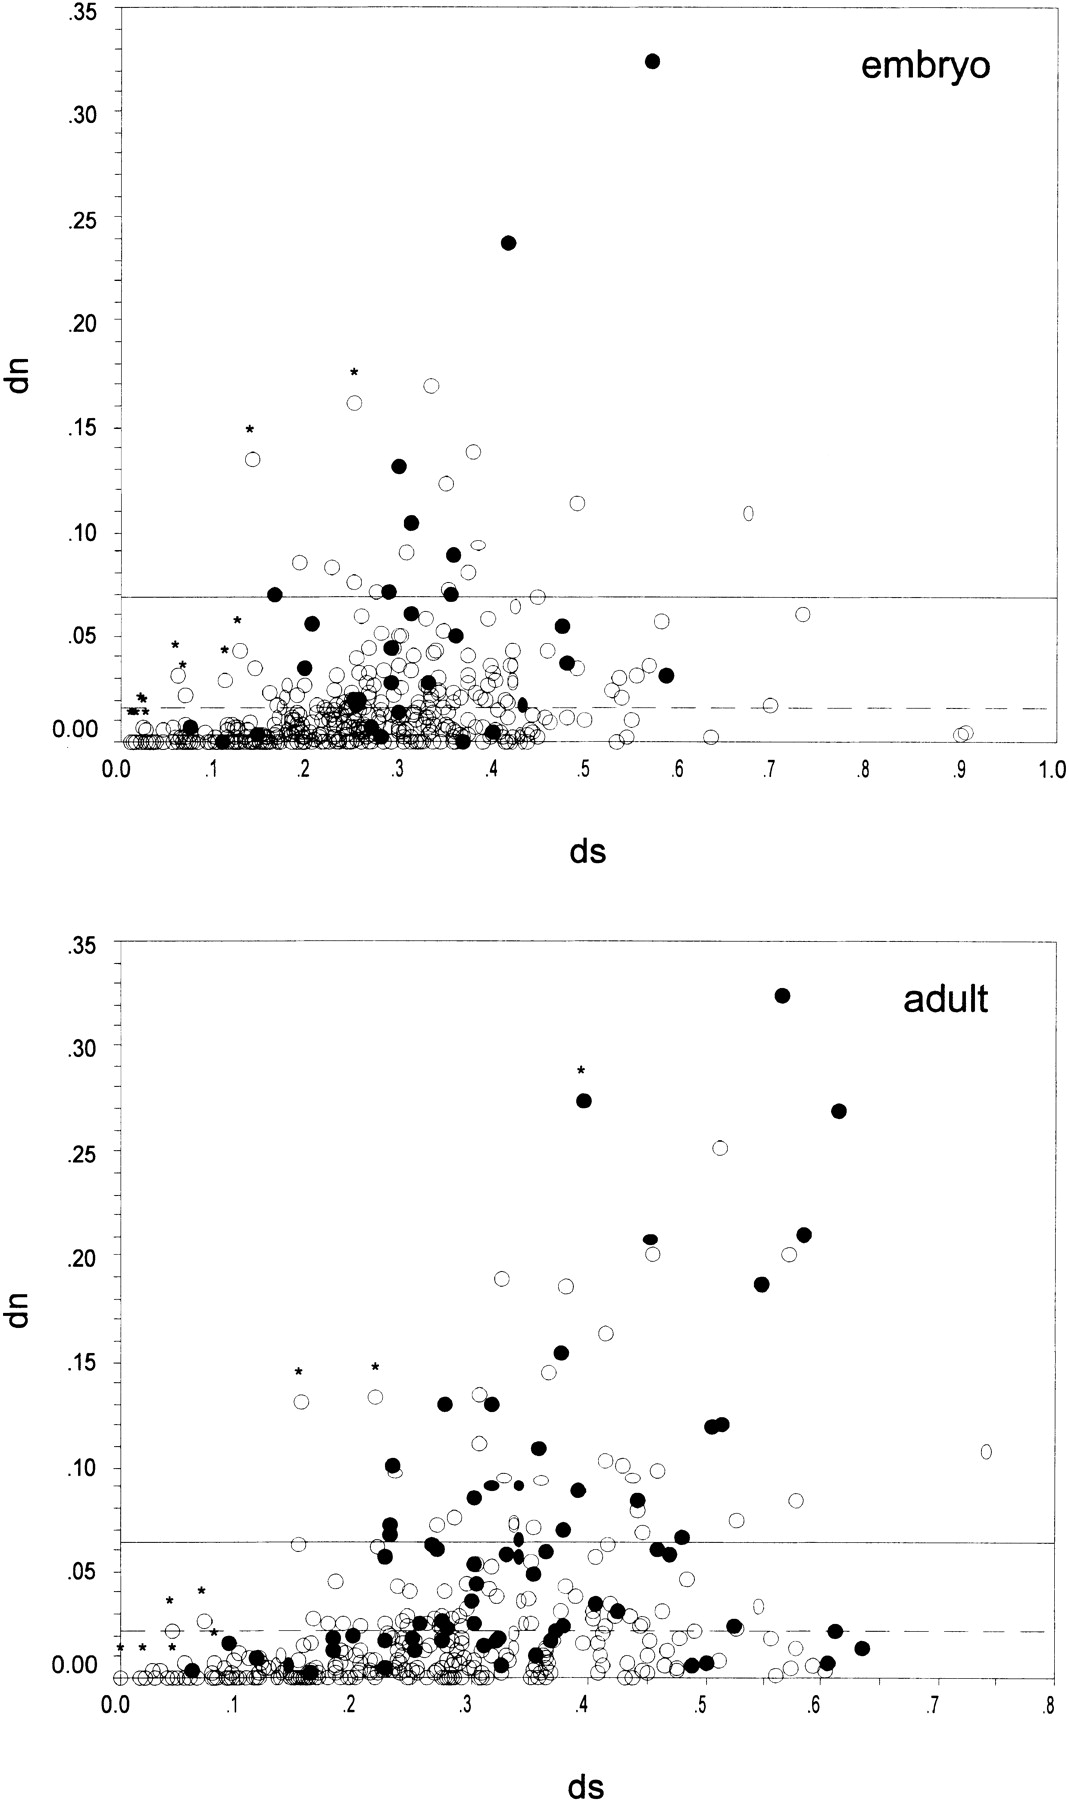
Figure 2
Scatterplot of the nucleotide substitution rates at synonymous (dS) and nonsynonymous (dN) sites for the embryo library (top) and adult library (bottom). (•) orphan genes; (○) nonorphan genes. The mean of the dN values for the orphan genes is marked as a solid line and for nonorphan as a dashed line. Genes for which the null hypothesis that dN and dS are equal cannot be rejected are marked with a star.