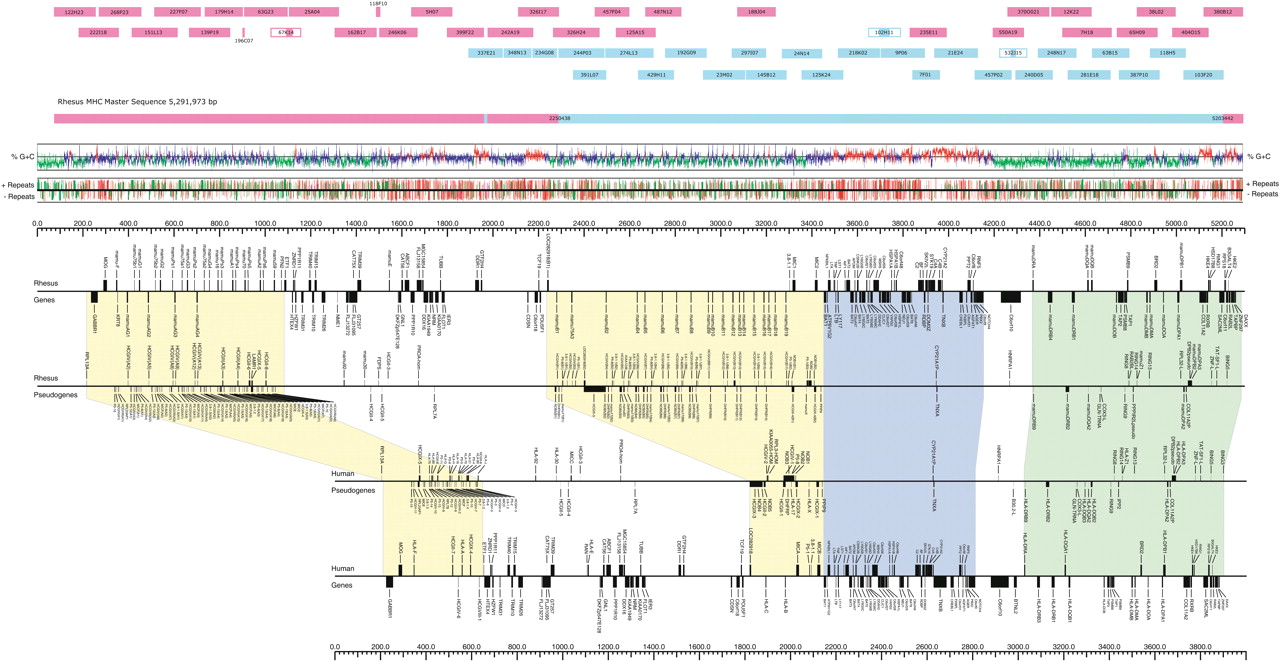
Linear representation of the rhesus macaque major histocompatibility complex (MHC) with telomeric end to the left and centromeric to the right. The following sections appear in the order from top to bottom: (1) a cartoon representation of the names and positions of BACs used to generate the contiguous rhesus MHC sequence. BACs colored in blue and red are from homologous chromosomes referred to in this study as haplotypes 1 and 2, respectively. The name of the BAC assigned by the CHORI resource (Eichler and DeJong 2002; http://www.chori.org/bacpac/) is indicated within the bar. In three cases, gaps were filled in with sequence derived from portions of shotgunned BACs as indicated by partial filling of the bar representing the respective BAC. In two cases, a PCR product derived from a BAC was used to span a gap between adjacent BACs of the same haplotype, as indicated by a thin bar with the derivative BAC name listed above. GenBank accession nos. for each of the independent sequences are to be added to this figure legend once published; (2) G+C content graphs are from 25% to 75% (the midline being 50%), showing the local G+C content as a deviation from the regional G+C content. Local G+C content uses a window size of 1 kb (which is the scale used) and regional (isochore) uses a window size of 30 kb. When the regional G+C content is lower than 43% it is painted green, above 50% red, otherwise blue. Immediately beneath, the interspersed repeat content is indicated with repeats color coded to indicate repeat family; (red) Alu; (pink) MIR; (green) LINE; (brown) all other repeats. Simple-sequence repeats and low-complexity regions are not depicted. Box height indicates repeat age, with repeats being graphed by identity to consensus, from 50% to 100% with identity corresponding to height. Because a human repeat library was used for analysis, very recent, macaque-specific repeats are interpreted as being older repeats of related families; (3) the position and name of each gene in the rhesus MHC are indicated above and below the line according to convention, indicating the gene orientation of forward and reverse, respectively. The gene content was established by comparison with human (MHC Consortium 1999) and by cross_matching masked sequences against the human EST database as described in Methods. Genes found in both rhesus and human are indicated by black bars, those with likely immune-related function with blue bars, and genes found in rhesus, but not human, are indicated by red bars. Immediately below are indicated the positions of pseudogenes in the rhesus MHC, all of which are indicated by black bars; (4) below these rhesus genes and pseudogenes is a similar annotation of the human sequence with pseudogene positions indicated above gene positions, all with the same color indicators for genes. The positions and names of pseudogenes in both rhesus (top) and human (bottom) are indicated with the homologous regions of the two sequences aligned. Between both the human and rhesus, the class I region genes are enclosed in yellow, class III region in blue, and the class II region in green. Above the rhesus genes and beneath the human genes are scales in kilobase pairs.