Figure 11
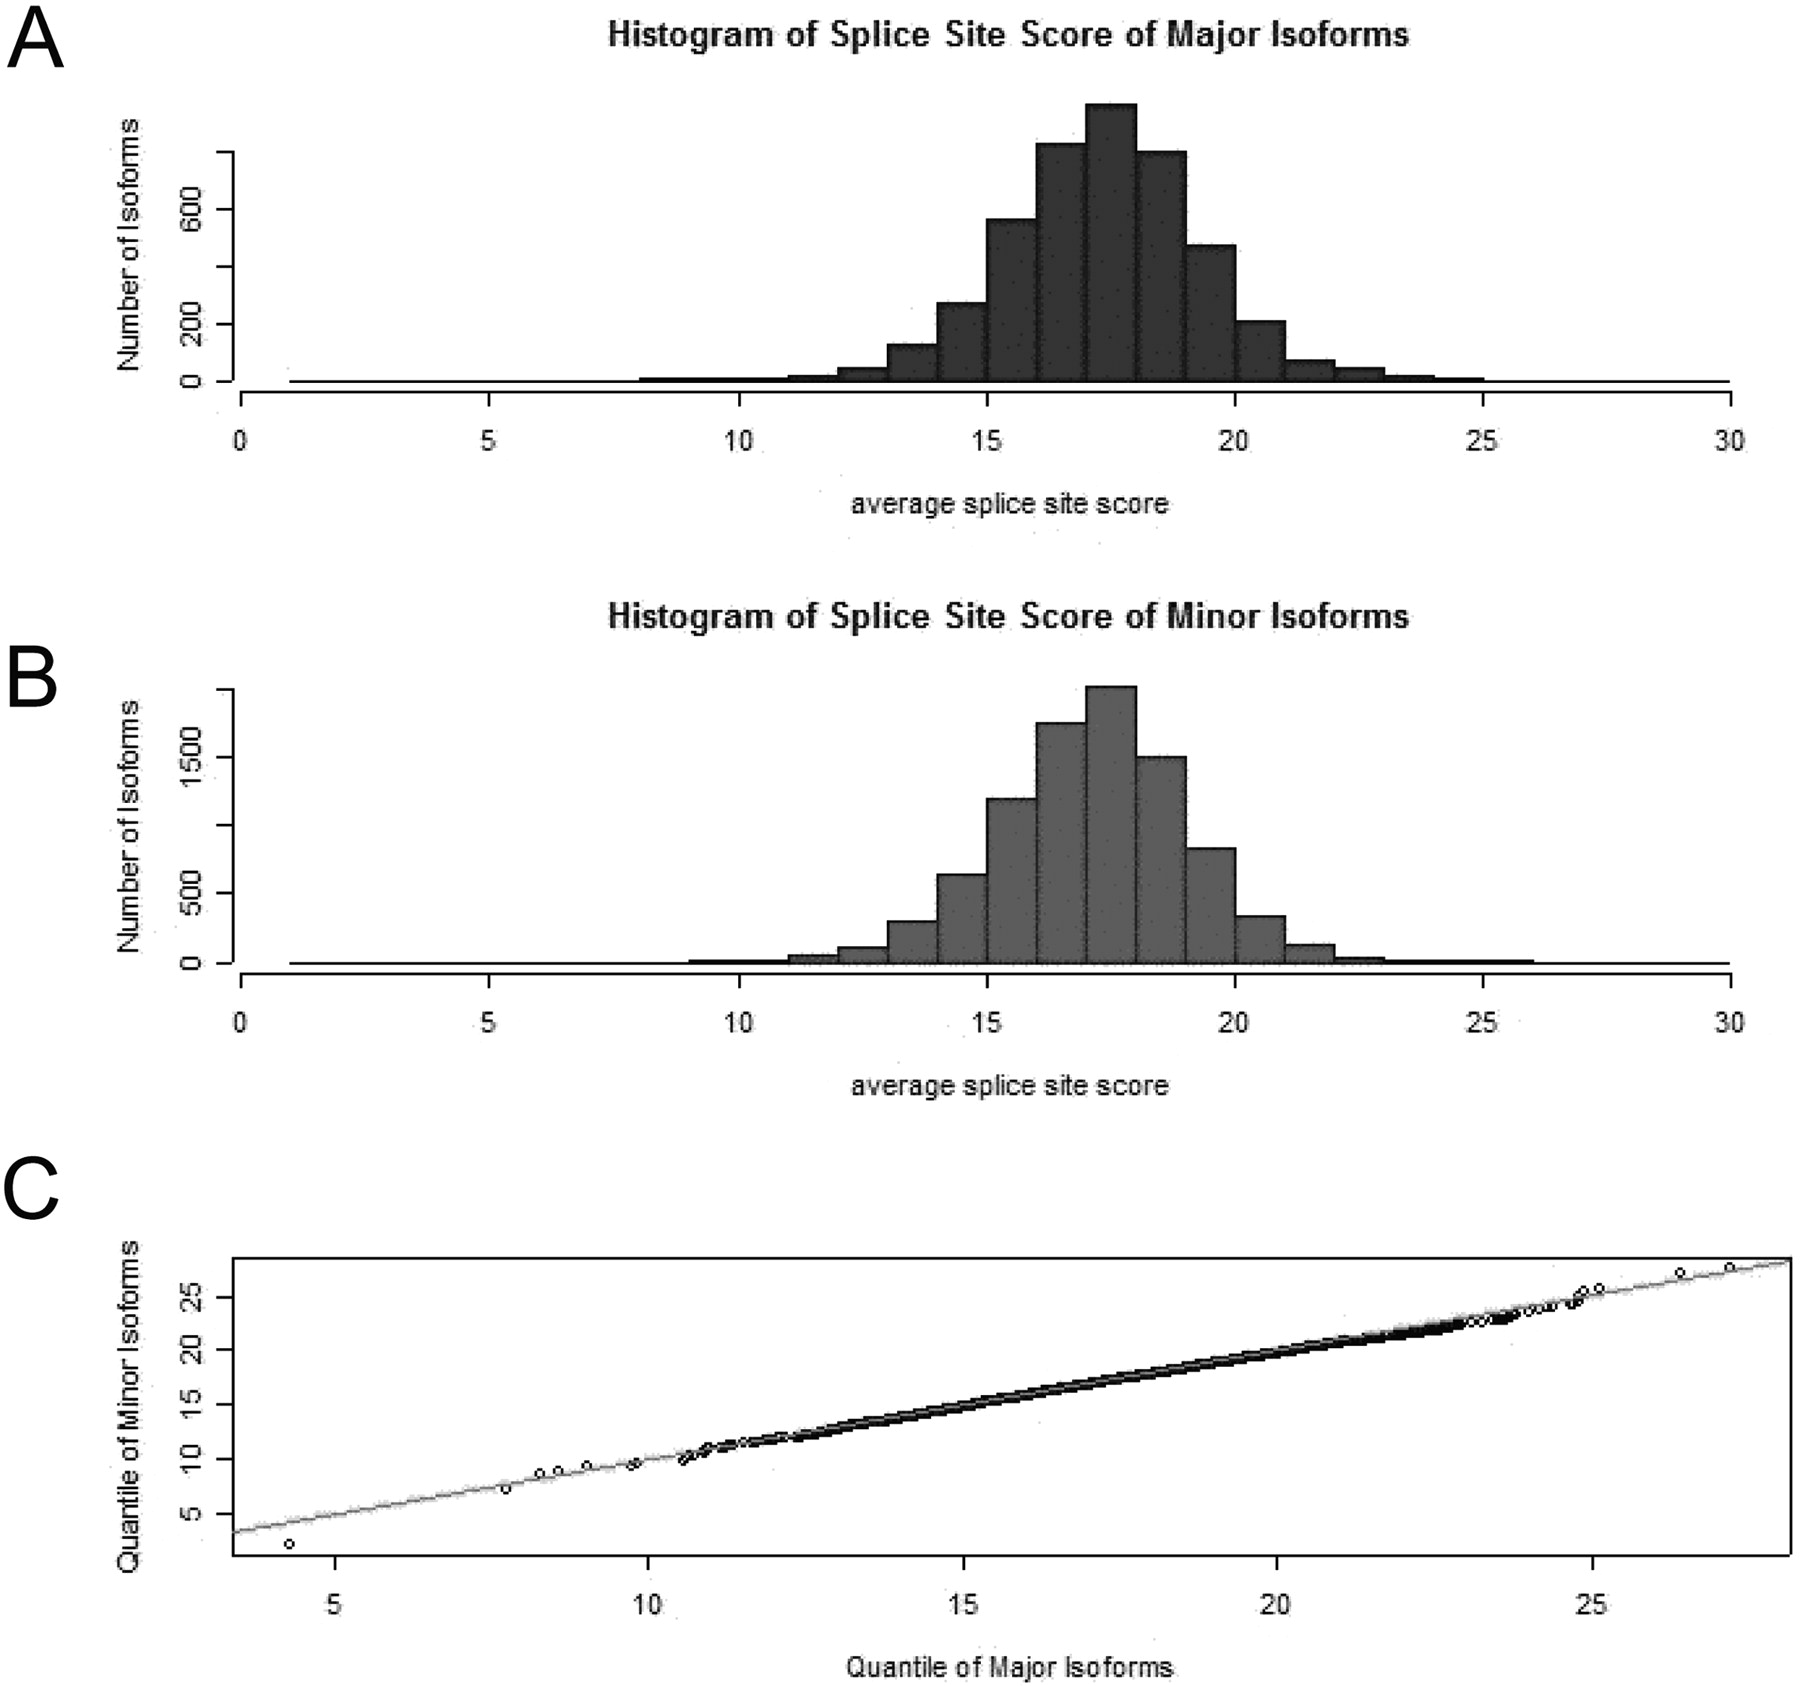
Comparison of splice site strength for major versus minor isoforms. Histograms of splice site strength for (A) major isoforms; (B) minor isoforms. (C) Quantile–quantile plot.
Comparison of splice site strength for major versus minor isoforms. Histograms of splice site strength for (A) major isoforms; (B) minor isoforms. (C) Quantile–quantile plot.