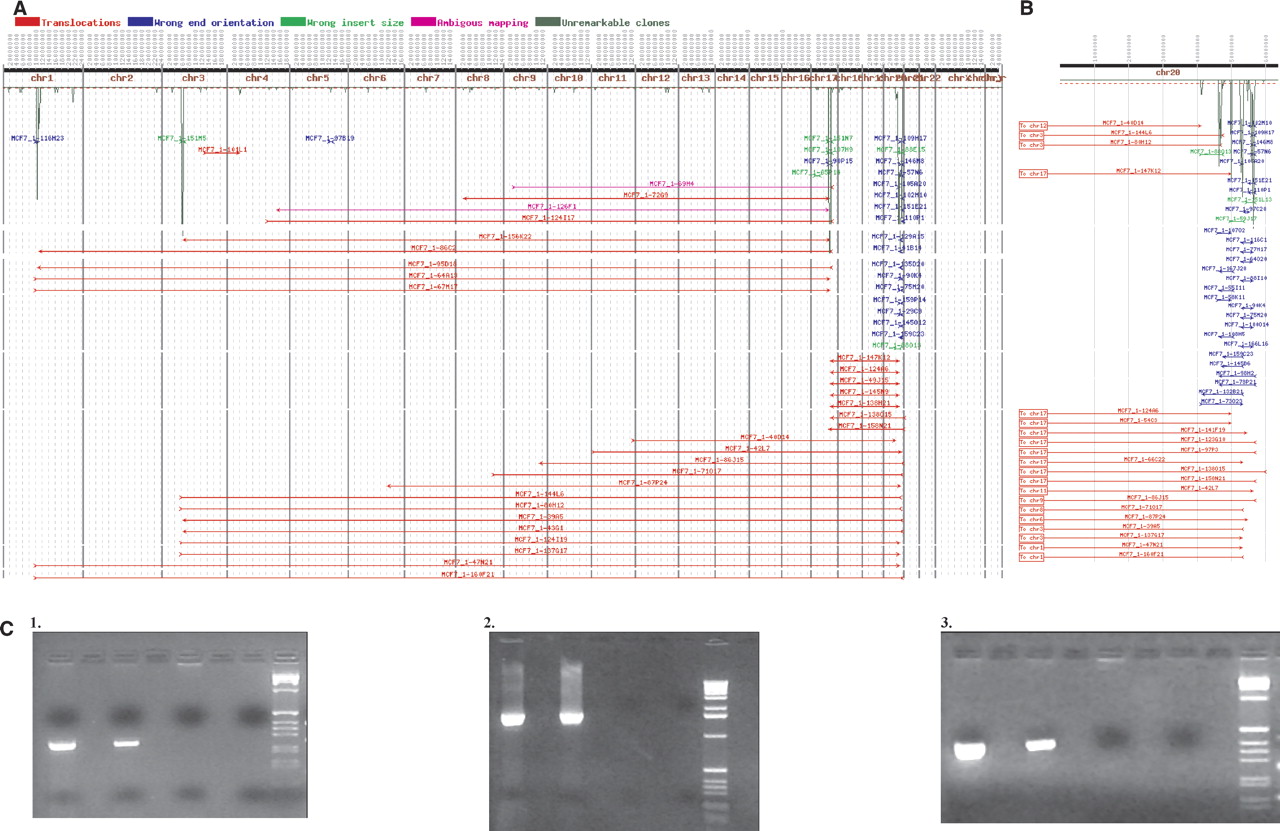
(A) The result of targeted ESP on amplicons mapping to chromosomes 1,3,17, and 20. A total of 434 end-sequence pairs were mapped onto the normal human genome sequence (represented as a horizontal line along the top). The dark-green plot represents the number of end sequences per 1-Mb interval. BAC end pairs with ends mapping to different chromosomes are shown as horizontal red lines. BAC clones with ends in the wrong orientation (not pointing toward each other) are shown in blue. BAC clones with ends mapping more than three standard deviations farther apart than the average BAC insert are shown in light green. A complete display with all mapped clones is at http://shark.ucsf.edu/~stas/ESP2/esp2.html, and a more detailed description can be found in Volik et al. (2003). (B) Chromosome 20 end-sequence density and end-sequence pair plots. (C) PCR confirmation of genome breakpoints in clones MCF7_1-37_E22 (1), MCF7_1-94_M14 (2), and MCF7_1-23_I06 (3). A shotgun library was constructed from the insert of each of these clones, and 96 plasmid subclones end sequenced. Plasmids with end sequences mapping to distant genomic loci were identified, and primers straddling the putative breakpoint were designed. In subpanels 1–3, the first lane is DNA from the corresponding BAC clone, the second lane is MCF-7 genomic DNA, the third lane is normal genomic DNA, the fourth lane is negative control, and the fifth lane is 1-kb ladder (Gibco-BRL).