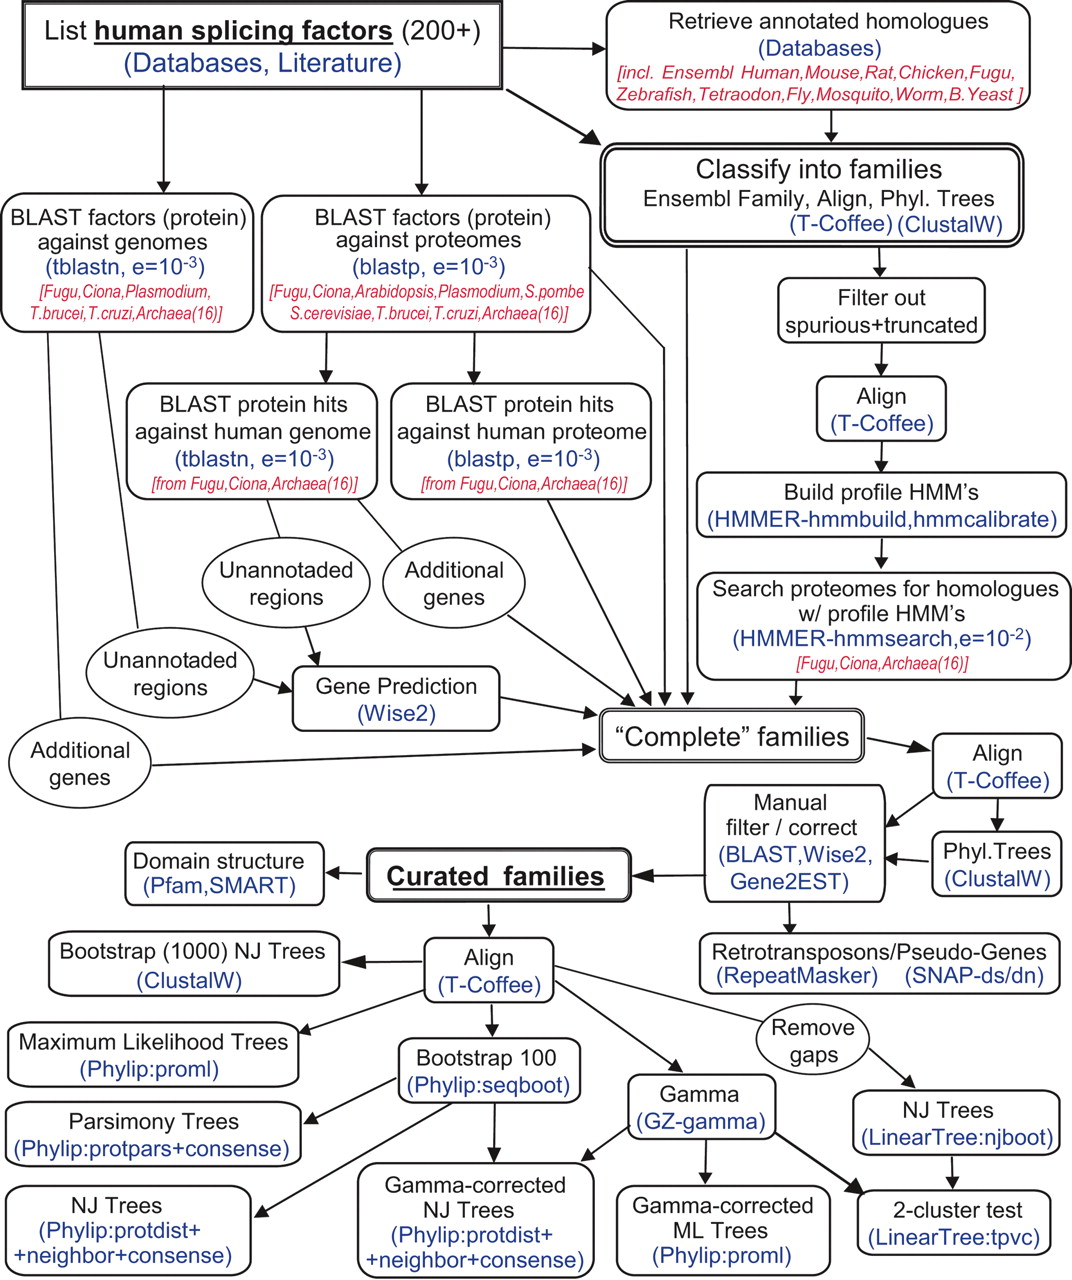
Figure 1.
Schematics of the computational pipeline flow. Sources, software, and parameters are represented in blue and species in red.
Schematics of the computational pipeline flow. Sources, software, and parameters are represented in blue and species in red.