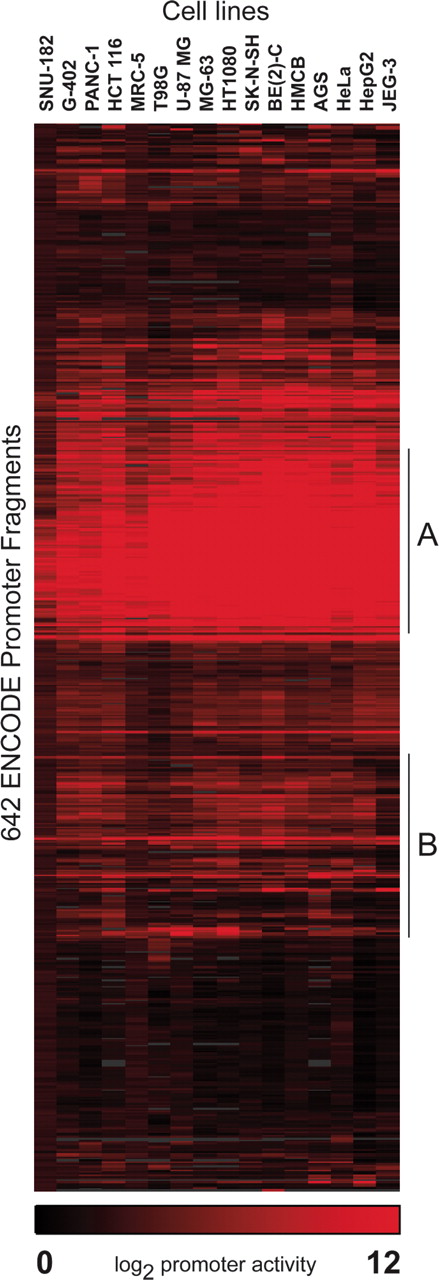
Figure 1.
Clustergram of 642 putative promoter fragments. The clustergram illustrates the hierarchical clustering of promoter activity among 16 diverse cell lines. Each row indicates the promoter activity of a fragment in each of the cell lines, with red indicating the degree of activity and black indicating no activity. Promoter activity has been normalized and log transformed to reflect comparable values between cell lines. Area A represents a cluster of promoter fragments with strong, ubiquitous activity in all cell lines and area B represents a cluster of promoter fragments that exhibit variable function across the 16 cell types.