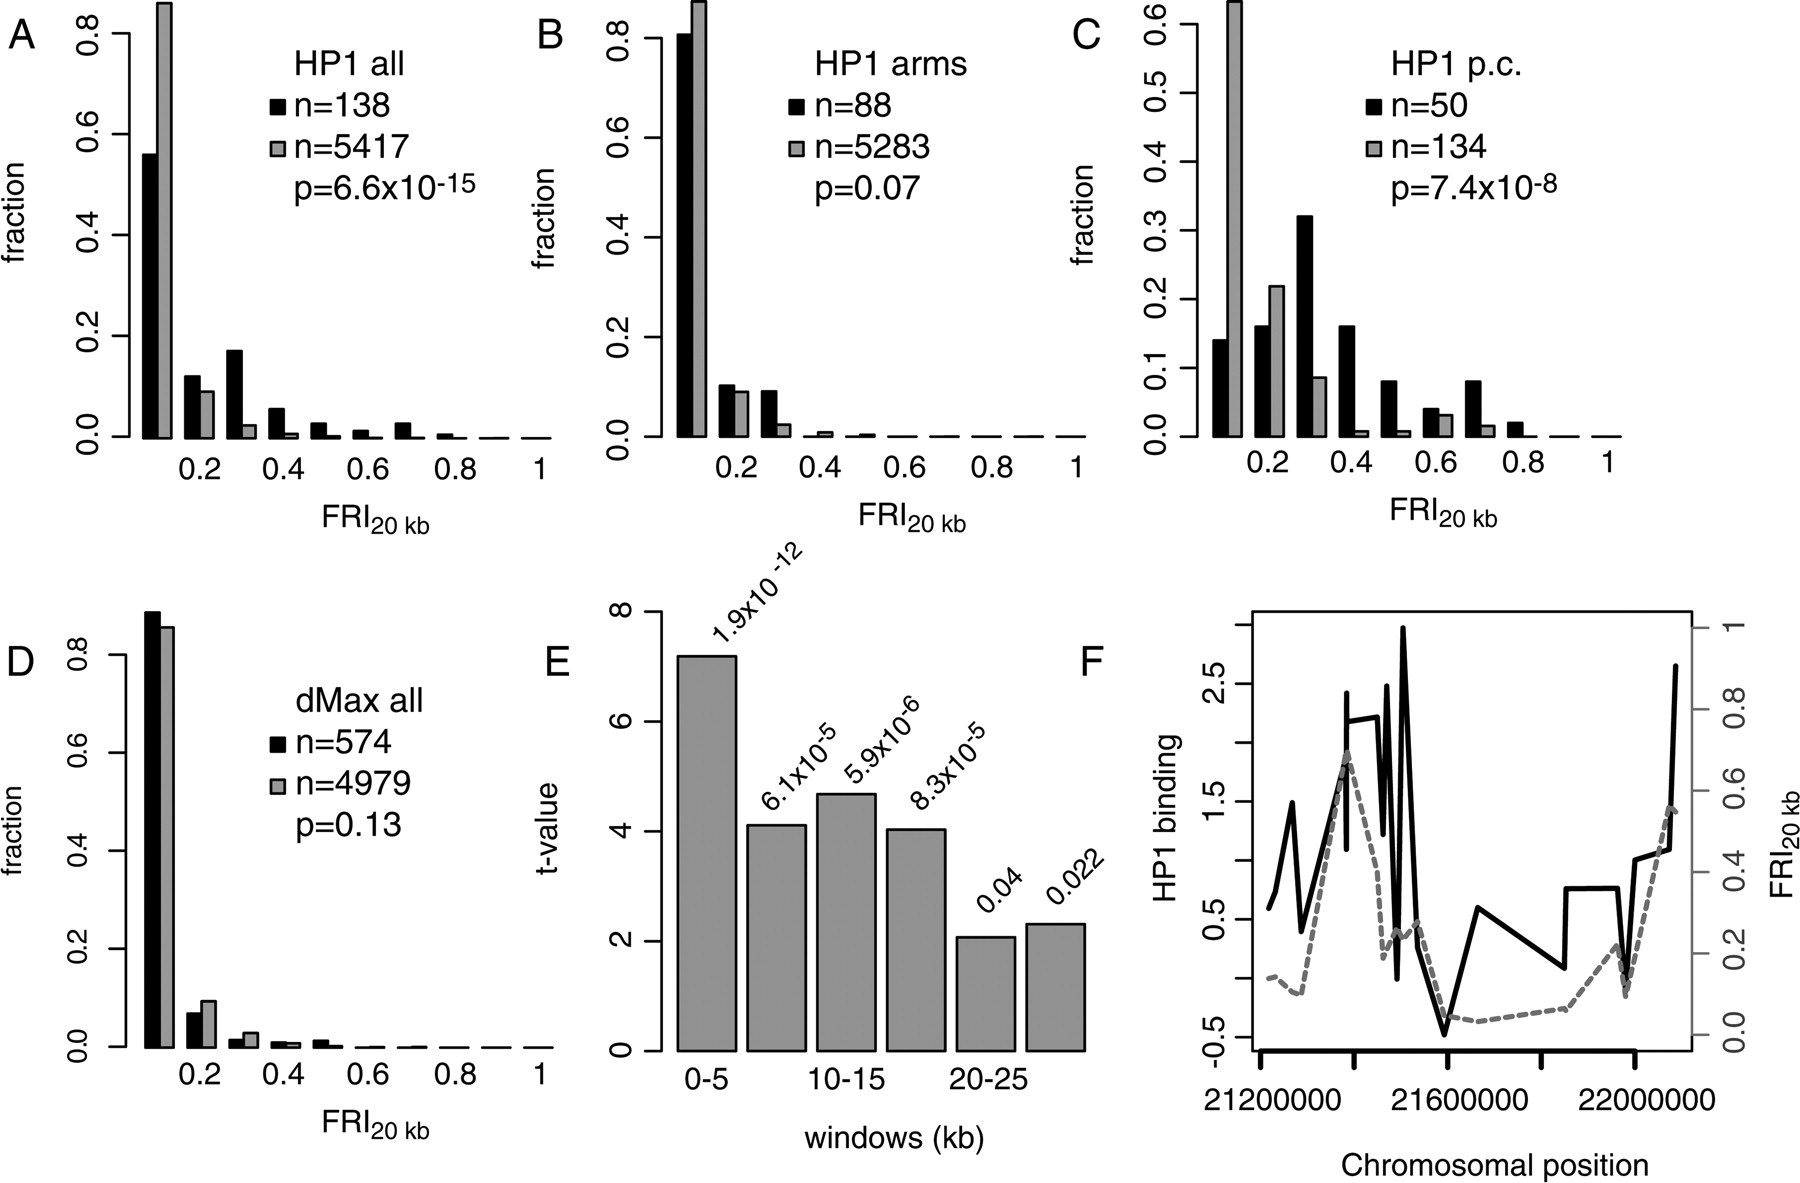
Binding of HP1 and Su(var)3-9 to genes in pericentric regions is correlated with flanking repeats. (A-D) Histograms of the distributions in FRI20kb for single-copy target genes (black bars) and non-target genes (gray bars) of HP1 (A-C) and dMax (D). (A) All probed genes on the arms and in the pericentric regions; (B) genes on the chromosome arms only, i.e., non-pericentric genes; (C) pericentric genes only. P values in A-D were calculated using the Wilcoxon rank-sum test. (E) The t values for linear regression of HP1 binding vs. FRI for windows at various distances from the probe; corresponding P values are printed above each bar. (F) A detailed view of the pericentric region of chromosome 2L, with HP1 binding (solid line, log2 ratio) and the FRI20kb (dashed line) plotted for all probes in this region.