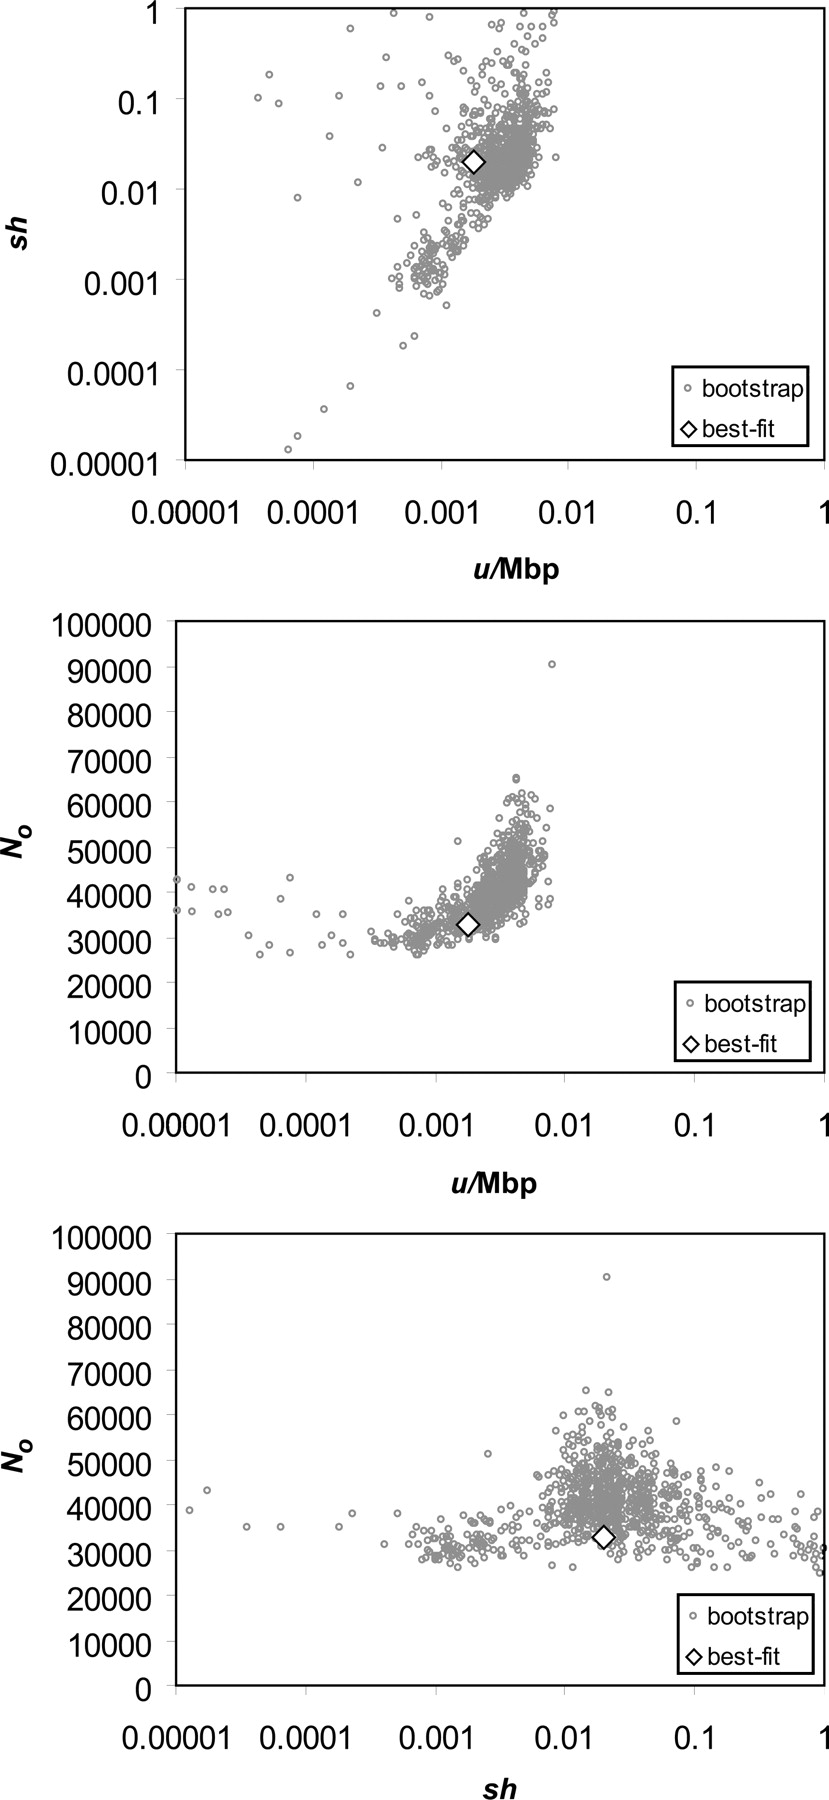
Figure 1.
Plots of the bootstrapping distribution of the estimated deleterious mutation rate (û/Mb), strength of selection (ŝĥ), and the effective population size without selection (N̂0). The best-fit value for all the data is contained in the weight of the outcomes. û and ŝĥ appear to be positively correlated (i.e., as the deleterious mutation rate increases, selection strength must also increase to maintain a similar outcome). û and N̂0 also appear to be correlated (as the deleterious mutation rate increases, the effective population size must also increase to maintain a similar outcome). A small number of points that were widely dispersed below ŝĥ = 0.00001 and/or û/Mb = 0.00001 are not included in the plot.