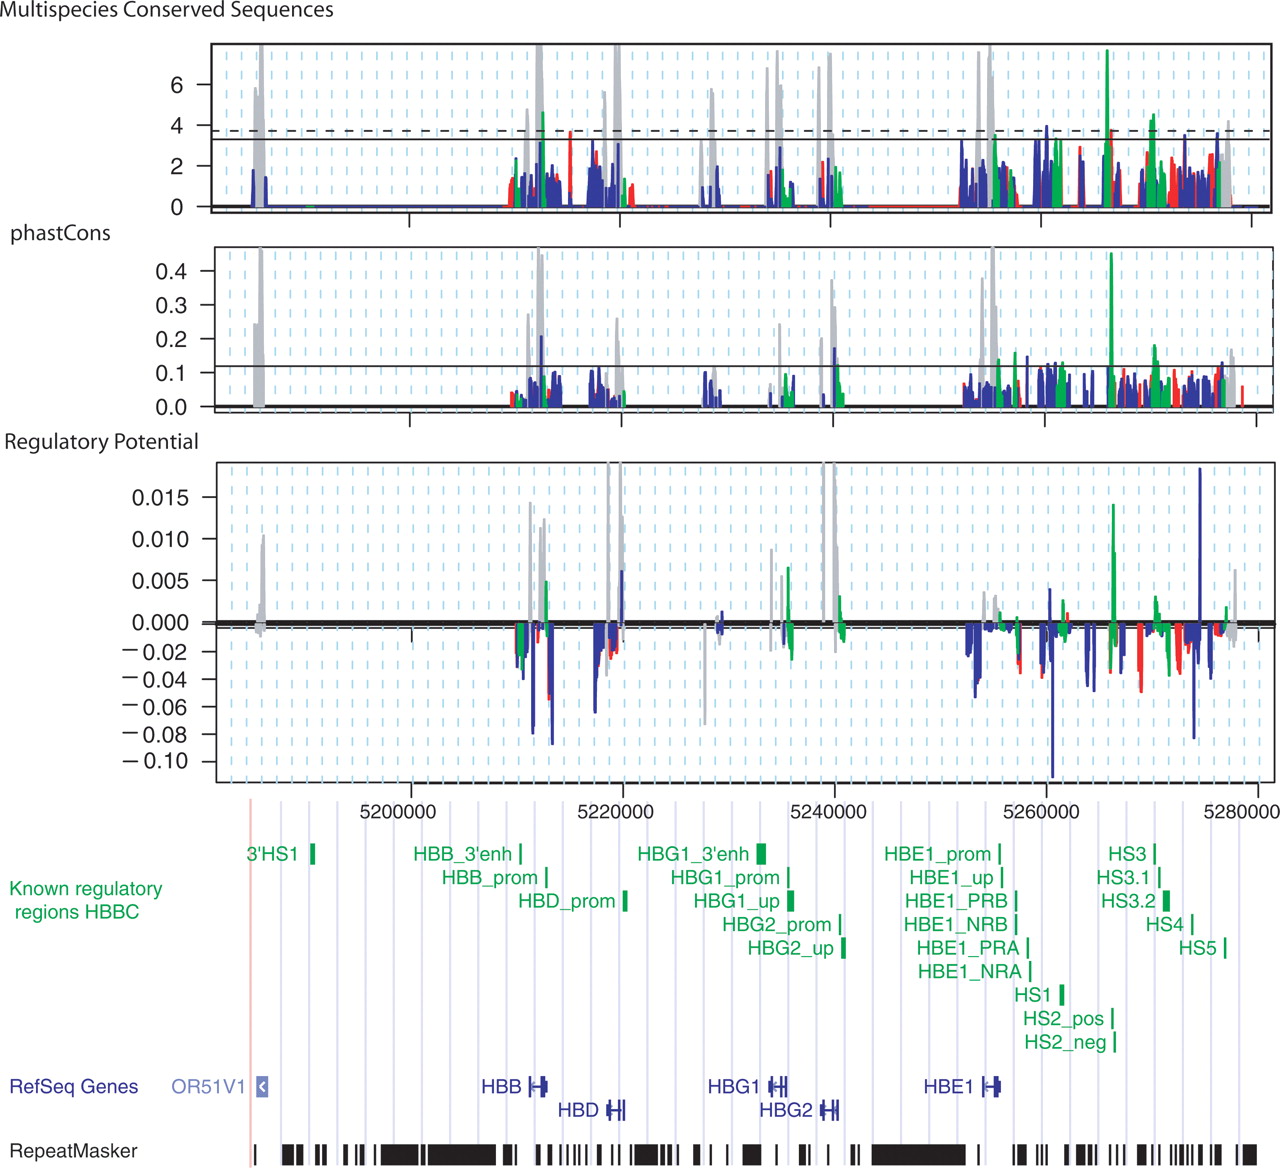
Conservation and RP scores for human–mouse–rat alignments in the HBB complex. The scores for MCS, phastCons, and regulatory potential (RP) are plotted in sliding windows along the HBB gene complex. Gray peaks show the scores for exons, which give the most pronounced signals in this region for all scoring methods. Scores overlapping known regulatory regions are shown by the green peaks, those overlapping repeats found by RepeatMasker (A.F.A. Smit and P. Green, unpub., http://ftp.genome.washington.edu/RM/RepeatMasker.html) are red, and scores in uncharacterized regions are shown as blue. A horizontal solid line represents the threshold with optimal performance (interval evaluation) for each score. The dashed line in the MCS graph is the threshold calculated by WebMCS, according to the 95th percentile of conserved sites. Below the graphs is a panel from the UCSC Genome Browser with the known CRMs in the HBB complex as a custom track (green), the RefSeq genes in blue, and repeats in black. The interval chr11:5227344–5229500 contains hemoglobinβ pseudogene 1 (HBBP1, RefSeq: NR_001589), which is also masked from further analyses.