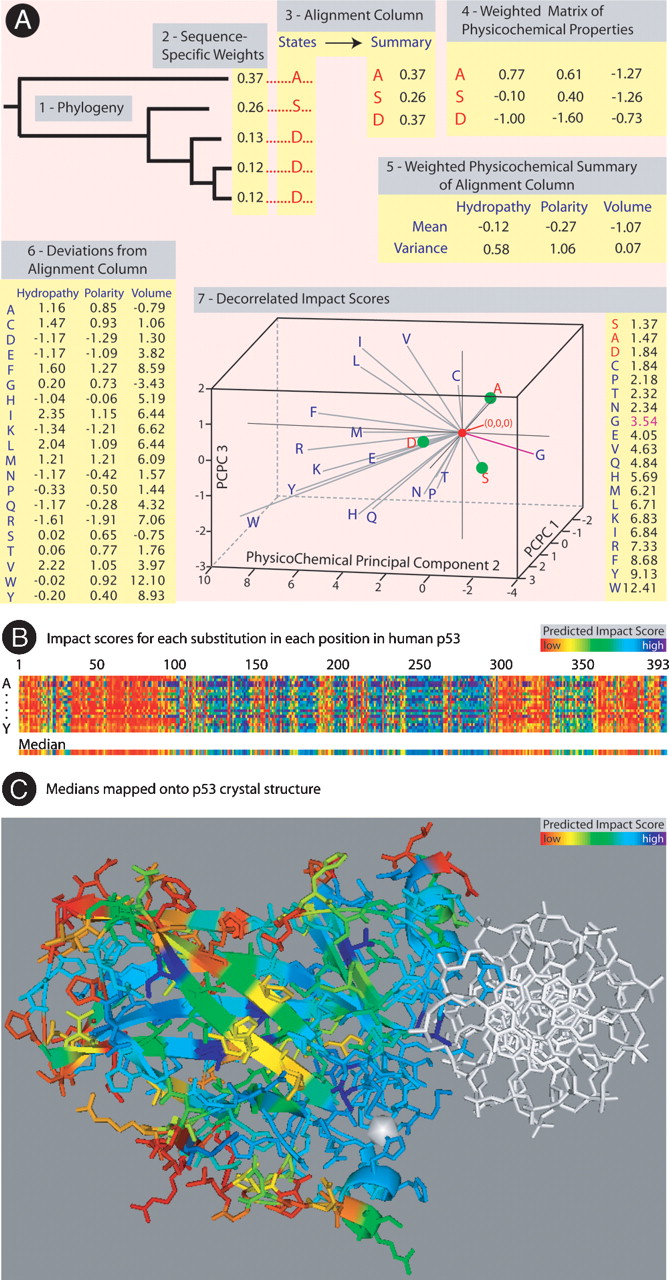
(A) MAPP's seven analysis steps. Evolutionary relationships of the protein sequences in the multiple alignment are inferred by likelihood analysis (1). Weights for each sequence are calculated to control for phylogenetic correlation (2). (The remaining steps consider each position in the protein independently and are illustrated for one such position.) Each column of the alignment is condensed into a summary in which each of the 20 amino acids is represented by the sum of the weights of those sequences carrying the amino acid at that position in the alignment (3). The summary is interpreted using a universal matrix of physicochemical property scales, only three of which are shown: hydropathy, polarity, and volume (4). The result is an estimate of the physicochemical constraints on each position in terms of the mean and variance of the property distributions observed in its alignment column (5). Deviations from the alignment column are obtained for each possible variant by calculating its property difference from the mean and dividing by the square root of the variance (6). To compute a single score measuring the violation of constraint across all properties, we first decorrelate the properties themselves by using a principal component transformation. The decorrelation gives rise to a new coordinate system in which each axis is a principal component; the distance from the origin to any variant is the variant's decorrelated impact score (7). (B) Each possible variant at each position in the protein is color-coded by its MAPP score, shown here for human p53. Each column corresponds to a position in human p53, in order of sequence. The spectrum of possible variants at each position reads from top to bottom, arranged alphabetically by one-letter amino-acid abbreviation. Scores for each variant are color-coded from low (red) to high (blue) as a heat map, with temperature inverse to the predicted impact of that change on the protein. The median score of possible variants at each position is shown below with the same color code. This median was used to color C. (C) Median MAPP scores plotted on the crystal structure of human p53 (Cho et al. 1994; DeLano 2002). Chelated Zinc and bound DNA are white.