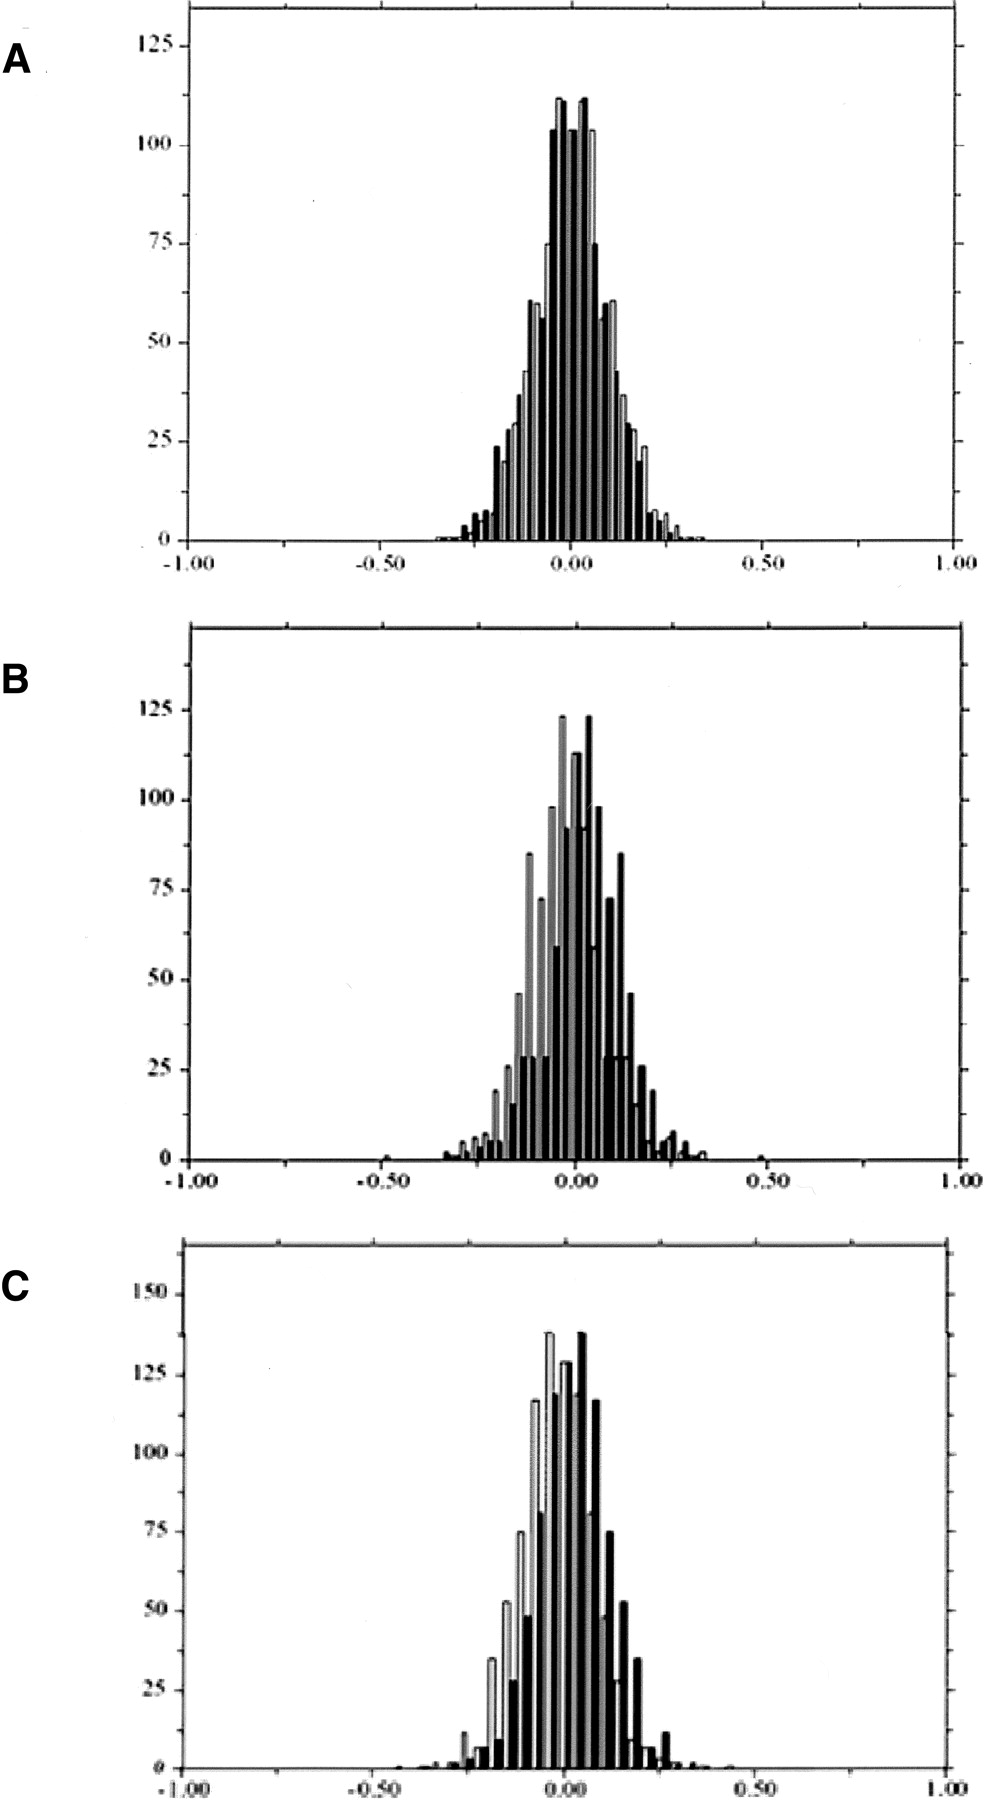
Figure 1.
Experimental error was estimated using four replicates of a human self-hybridization. The number of probes (y-axis) with a given Cy5/Cy3 log2 ratio (x-axis) is shown with black bars for the human probes and with clear bars for the (A) chimpanzee probes (mean difference 0.03), (B) orangutan probes (mean difference 0.05), and (C) rhesus probes (mean difference 0.04). The difference between the distributions of log2 ratios from different probe sets reflects the experimental error due to the hybridization to different probes on the array.